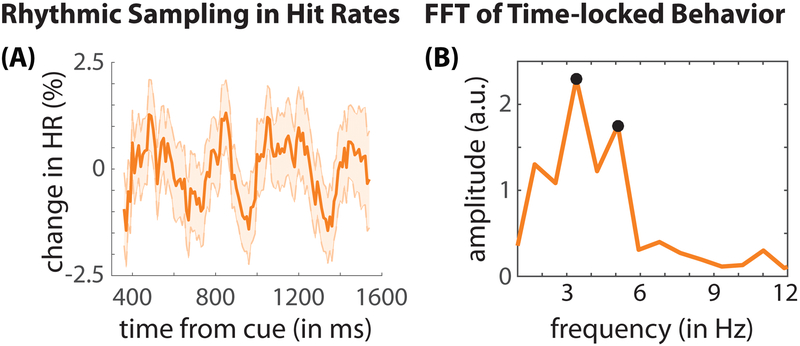
Figure 2. Evidence of rhythmic sampling in monkey behavioral data.
(A) Displays the change in hit rates (HRs) at the cued location as a function of the time from cue (i.e., at different cue-target delays). Behavioral data were compiled across all recording sessions from two monkeys. These data have been linearly detrended, aiding visualization of the periodic effects (see Fig. S2 for the behavioral times-series data prior to detrending). The shaded regions around the lines represent standard error of the mean. (B) The fast Fourier transform (FFT) was then used to convert behavioral time-series data into the frequency domain (Fiebelkorn et al., 2011; Fiebelkorn et al., 2013a). The black dots represent statistically significant peaks after corrections for multiple comparisons, demonstrating significant theta-band rhythmicity in monkey behavioral performance.

