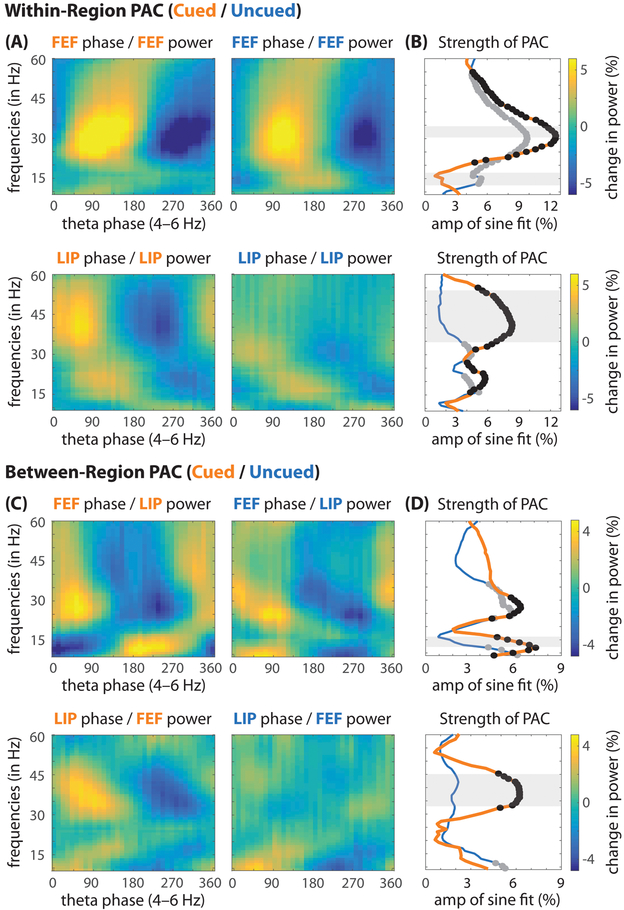
Figure 4. Theta phase in the frontoparietal network modulates higher-frequency power.
All plots show the percent change in power (relative to the mean power at each frequency, from 9–60 Hz), as a function of theta phase. (A, B) Within-region phase-amplitude coupling (PAC), between theta phase and higher-frequency power, when response fields overlapped either the cued (orange) or the uncued (blue) location. (B) The strength of this coupling was measured by using the fast Fourier transform to extract the amplitude of a one-cycle, sinusoidal component (Fig. 3A, B). The black (cued location) and gray (uncued location) dots represent statistically significant PAC after corrections for multiple comparisons. The shaded regions represent statistically significant differences in PAC between the cued and uncued conditions. (C, D) Between-region PAC (67 recording sessions with matching response fields in FEF and LIP), again linking theta phase and higher-frequency power.

