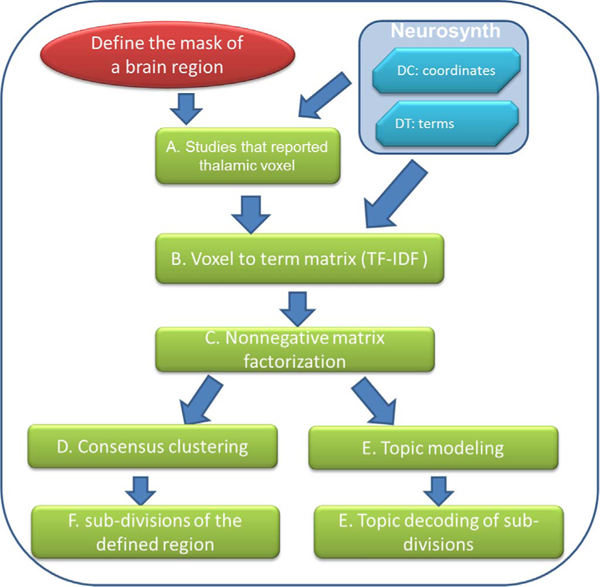
Fig. 1.

The flow chart to illustrate the steps of MAPBOT. DC is the “document to coordinate” matrix; DT is the “document to terms” matrix; tf is the term frequency and idf is the inverse document frequency (see main text). In this study, the mask of the example brain region, the thalamus, was defined by down-sampling the Morel template volume (Morel et al., 1997; Krauth et al., 2010).
