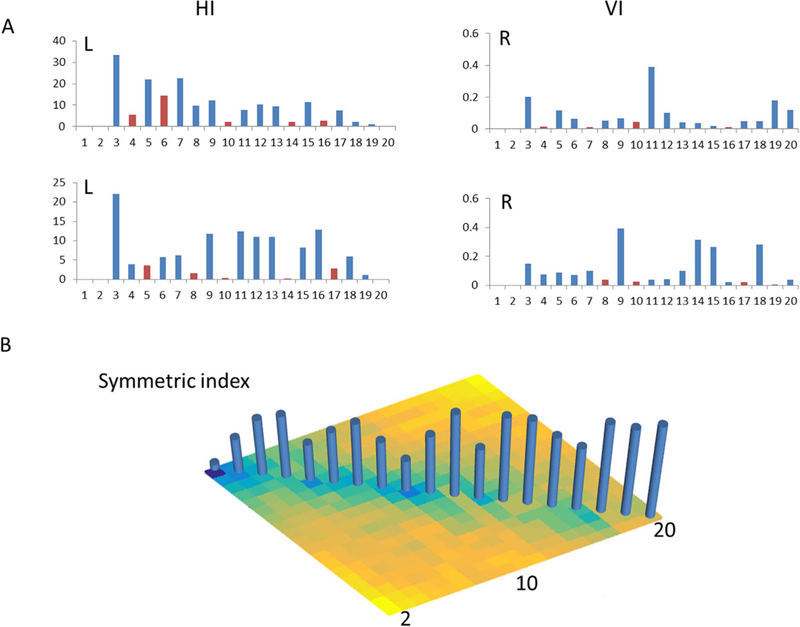
Fig. 2.

Metrics of the parcellation: the Hartigan index (HI), variance of information index (VI) and symmetric VI. The red bar indicates a potential optimal cluster solution. Shown for the applied case of the thalamus over the range of investigated factor ranks, 2<= k< = 20.
