
Fig. 6.
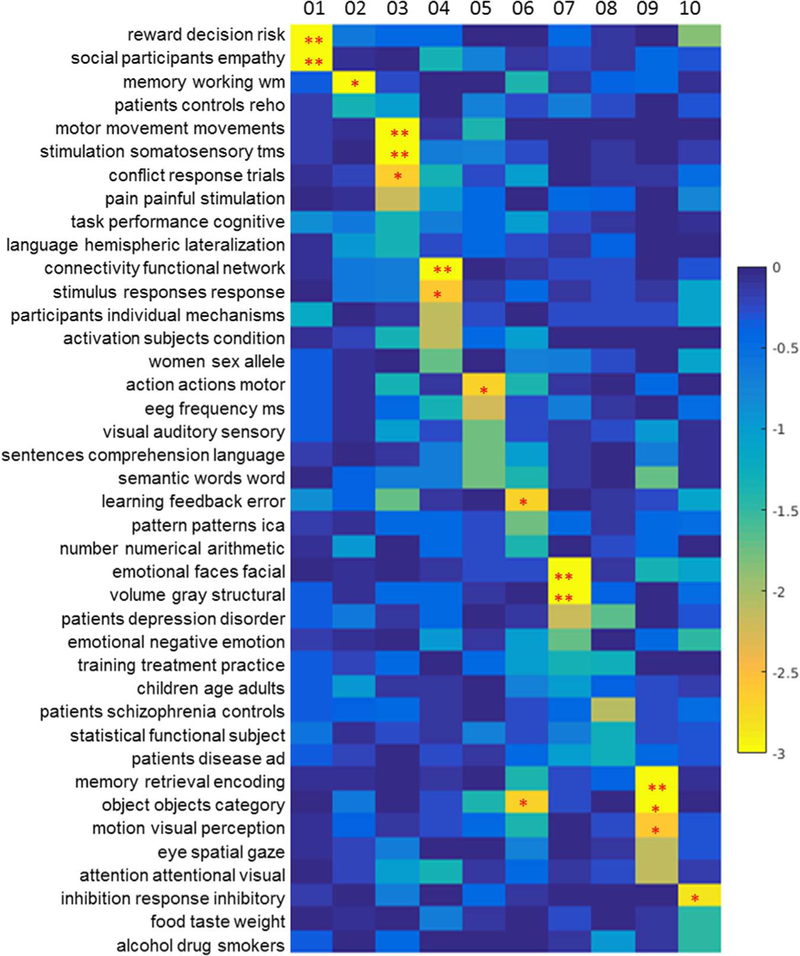
The topic mapping of Clusters 1–10 (right side) from topic set 50. This figure graphically shows relations detailed in the first column of Table 2. Each element of this map represents the significance of the relation between each topic (row) and cluster (column), shown as log10(P) (thus, the lower the value, the stronger relation is; see the colorbar on the right). A single asterisk (*) indicates P < 0.01 (uncorrected) and two asterisks (**) indicate P < 0.05 (with Bonferroni correction).