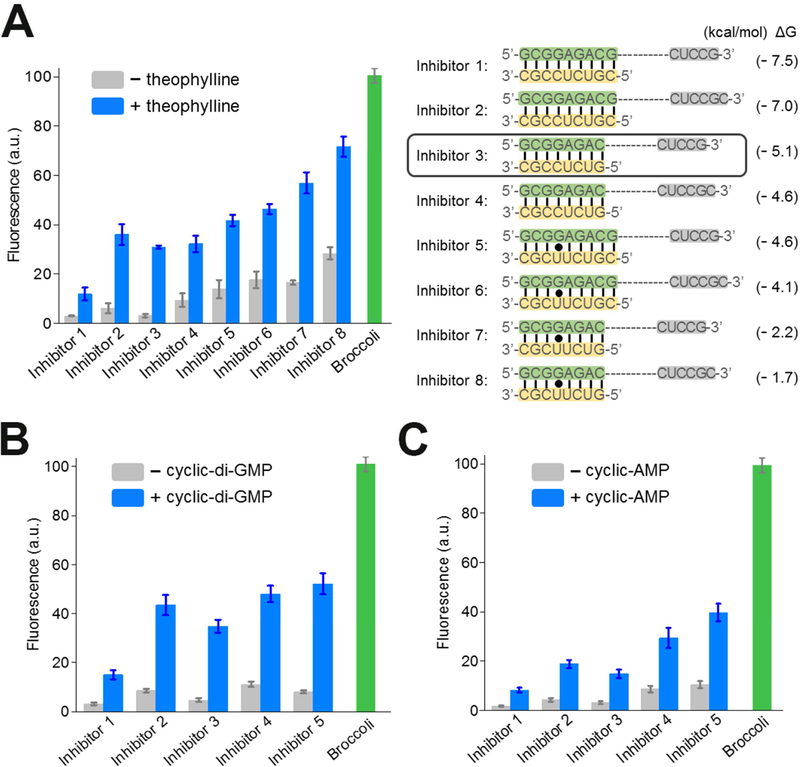
Figure 2. Optimization of the RNA integrator performance.
(A) Optimization of inhibitor sequences. In each case, the A’ inhibitor strand (yellow) forms a duplex with the A strand region (green) in Broccoli. After the target-induced cleavage of HHR, the A strands can instead form duplexes with an A” sequence (grey), which is a component of Broccoli stem required for the fluorescence activation. Shown are mean and SEM values of three independent replicates. The predicted Gibbs free energy change (ΔG) during hybridization switch between the A-A’ duplex and A-A’’ duplex was calculated using mfold online software (Zuker, 2003).
(B and C) Optimization of (B) cyclic di-guanylate-targeting and (c) cyclic adenosine monophosphate-targeting RNA integrators. Sequences of Inhibitor 1 – 5 are indicated in Figure 2A. Shown are mean and SEM values of three independent replicates.

