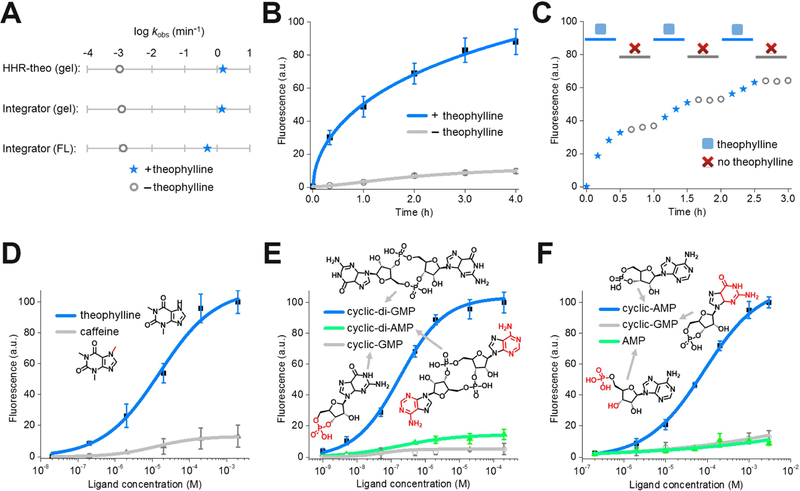
Figure 4. In vitro characterization of the HHR-based RNA integrator.
(A) The apparent cleavage rate constant and fluorescence activation rate constant of theophylline-regulated RNA integrator. The apparent cleavage rate constant was measured in a 6% TBE-urea gel using either RNA integrator or previously reported allosteric theophylline-regulated HHR structure (HHR-theo) (Soukup et al., 2000). Shown are the measured rate constants after adding either 0 μM (open grey circle) or 200 μM theophylline (blue star).
(B) Measurement of the rate of RNA integrator activation. As can be seen, addition of 200 μM theophylline led to rapid signal acquisition (blue), with more than half of the total fluorescence signal appearing in ~55 min. Shown are mean and SEM values of three independent replicates.
(C) Fluorescence accumulation of the RNA integrator during repeated addition-and-removal of the target. A rapid signal increase was observed during the 30 min incubation with 200 μM theophylline (blue star). A gel filtration spin column was then used to remove the theophylline (open grey circle). After 30 min, 200 μM fresh theophylline was added again (blue star). This cycle was repeated three times.
(D – F) Dose-response curve for fluorescence activation of the (D) theophylline, (E) cyclic di-guanylate, and (F) cAMP RNA integrator by target or analogs. Shown are mean and SEM values of three independent replicates. Chemical structures of analogs are drawn with differences from the target indicated in red.

