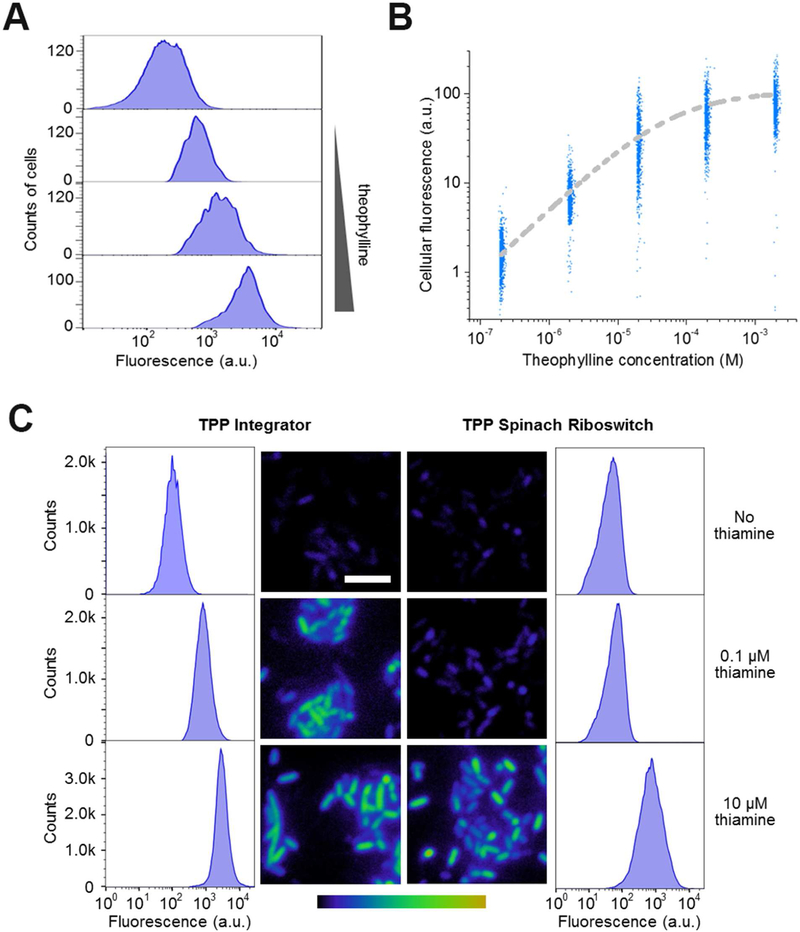
Figure 5. Metabolite detection in living cells using the RNA integrator.
(A) Theophylline-induced fluorescence activation in E. coli. Cells expressing the theophylline integrator were incubated with 0, 2, 20, or 200 μM theophylline (up to bottom) for 3 h and then fluorescence signal from 5,000 individual cells was quantified in each case by flow cytometry.
(B) Dose-response curve for cellular fluorescence activation of the theophylline integrator. At each concentration, shown are the individual fluorescence values of 1,000 representative cells as measured by flow cytometry after 3 h incubation with theophylline.
(C) Sensitivity of the RNA integrator for the cellular imaging of TPP biosynthesis. We used a previously reported Spinach riboswitch (You et al., 2015) as the control. In this experiment, after culturing in thiamine-free media for 2 h, we added 0, 0.1 μM, or 10 μM thiamine and imaged the cellular fluorescence level after another 3 h incubation. Images are pseudocolored to show the fold increase in fluorescence at each time point relative to 0 min without adding thiamine. Color scale represents 0- to 15.0-fold changes (black to yellow) in fluorescence signal. Scale bar, 5 μm. In addition, flow cytometry was used to quantify the fluorescence of 100,000 individual cells in these cases.

