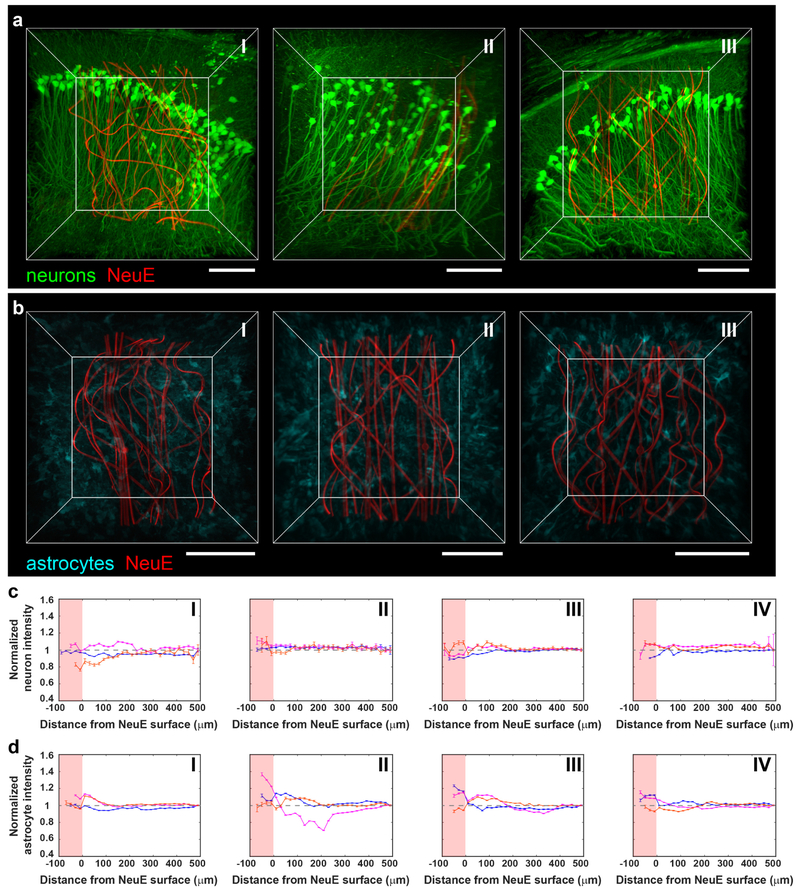
Fig. 2 |. Time-dependent 3D histology studies of NeuE/brain interfaces.
a, 3D interfaces between NeuE (red) and neurons (green) at 2 days (I), 2 weeks (II) and 3 months (III) post-implantation. Scale bars, 100 μm. b, 3D interfaces between NeuE (red) and astrocytes (cyan) at 2 days (I), 2 weeks (II) and 3 months (III) post-implantation. Scale bars, 100 μm. c,d, Normalized fluorescence intensity of neurons (c) and astrocytes (d) as a function of distance from the 3D NeuE boundary at CTX (orange), hippocampal CA1 (magenta) and DG (blue) at 2 days (I), 2 weeks (II), 6 weeks (III) and 3 months (IV) post-implantation. The pink-shaded regions indicate tissue volumes within the interior of the NeuE. The relative signal was obtained by normalizing the fluorescence intensity with the baseline value defined as the fluorescence intensity averaged over a range of 480–500 μm away (gray dashed horizontal lines; Supplementary Note 4). The tissue volumes for analysis depend on the specific structures of the distinct brain regions as shown in Supplementary Fig. 5a,b. All error bars reflect ±1 s.e.m. There is substantial neuronal density, 91±12% (mean ± s.d.) of baseline, in the interior of the NeuE probe boundary as early as 2 days, and this increases to 100±7% of baseline at times extending from 2 weeks when the neurons exhibit a fully endogenous distribution in the DG, CA1 and CTX regions. The astrocyte density is 107±8% of baseline at 2 and 14 days, and is uniform at the endogenous level, 102±3%, at longer times. Time-dependent 3D histology studies have been repeated on N=3 independent samples; additional fluorescence images and quantitative analyses are shown in Supplementary Figs. 6 and 7.

