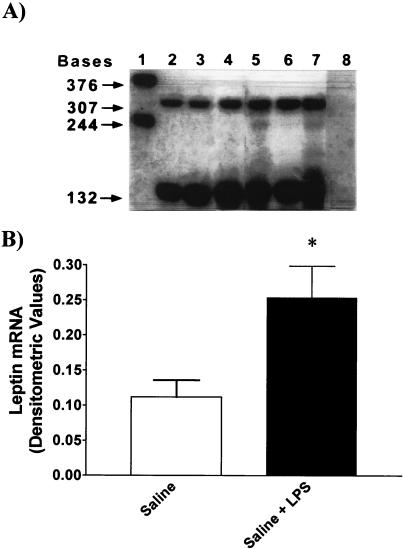
Figure 9.
(A) Representative autoradiogram showing the detection of leptin (307 bases) mRNA expressed in total fat RNA (12 μg) from control (lanes 2–4) and LPS-treated rats (lanes 5–7) and digested cyclophilin (132 bases; lanes 2–7). Lane 1 illustrates the undigested, full-length RNA probes for leptin (376 bases) and cyclophilin (244 bases). In lane 8, where no hybridization is seen, 12 μg of yeast tRNA was used. (B) Composite drawings showing the densitometric quantitation of the bands from two blots corresponding to the fat leptin mRNA isolated from control and LPS (*, P < 0.05 vs. saline).

