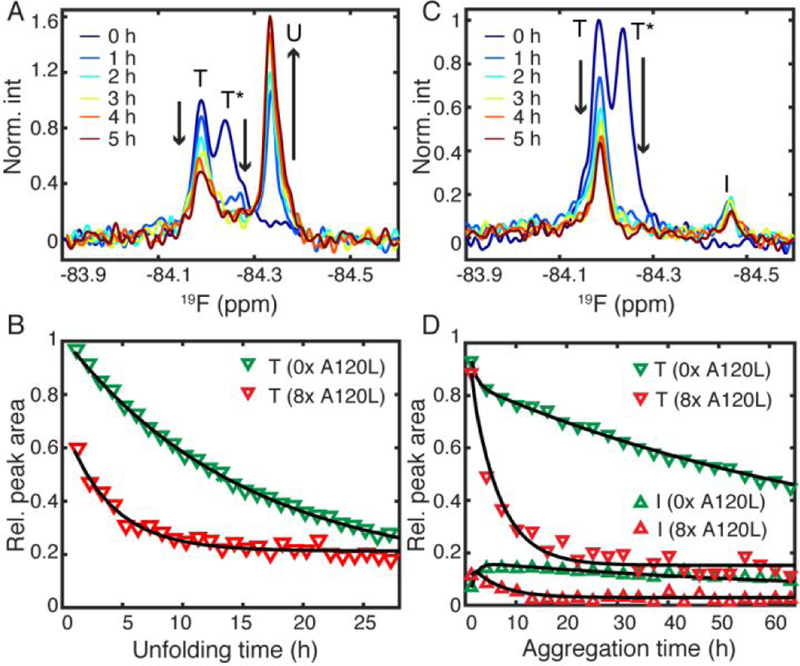
Figure 3.

(A) 19F-NMR spectra before and after unfolding by 6 M urea. (B) Unfolding kinetics of T with 8-fold A120L (A) in red and without premixed A120L (green). Black lines are single exponential fits. (C) Acid-mediated aggregation of TTRF premixed with 8-fold A120L. (D) The aggregation kinetics of T and I in (C) are shown in red. For comparison, the aggregation data of TTRF alone are plotted in green.10 Black lines are fits from a three-state kinetic model (see main text).
