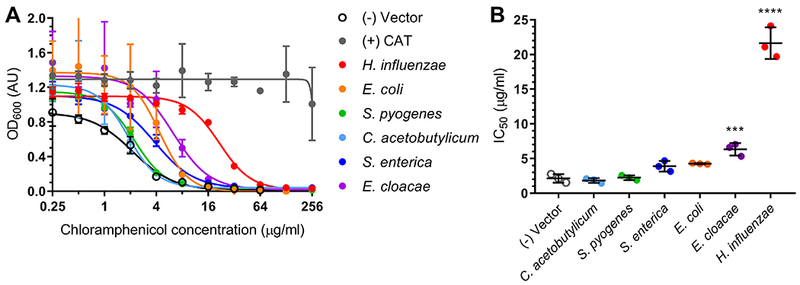
Figure 2. Reductase expression can alter susceptibility of E. coli to chloramphenicol.

(A) Dose-response curves of microbroth dilution assays for E. coli expressing predicted reductase gene homologs in the presence of chloramphenicol with (B) corresponding 50% inhibitory concentrations (IC50) calculated from the curve fit. All points are averages of triplicate experiments with standard deviation error bars. Statistical significance was calculated with respect to the vector control by ordinary one-way ANOVA with Dunnett’s correction for multiple comparisons. Adjusted p-value displayed as p≤0.0001 (****), p<0.001 (***). Abbreviation: CAT, chloramphenicol acetyltransferase.
