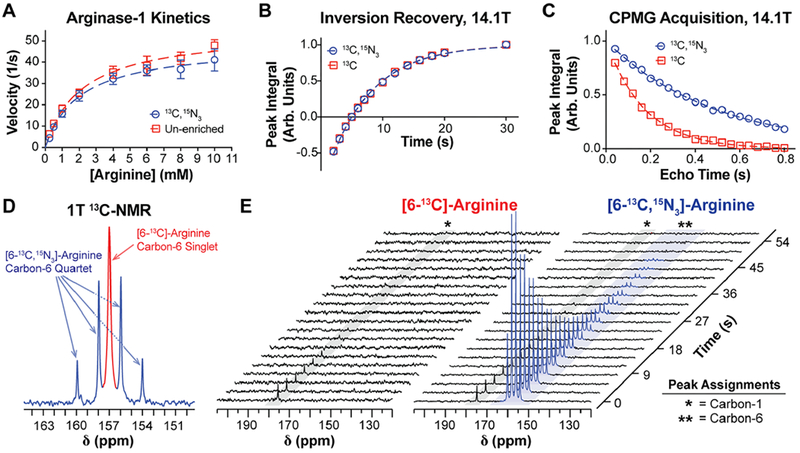
Figure 3.

Biochemical and spectroscopic properties of [6-13C,15N3]-arginine. (A) Enzyme kinetics of recombinant human arginase-1, using either natural abundance arginine (red) or [6-13C,15N3]-arginine (blue) as the enzymatic substrate. Data points were fit to the Michaelis–Menten kinetics model (dashed lines) to approximate Km and Vmax, revealing no significant difference in Km but a significant 13% decrease in Vmax with isotopic enrichment. (B) Inversion recovery and (C) CPMG acquisitions on the carbon-6 resonance of each arginine variant at 14.1 T, which were used to measure T1 and T2, respectively. At 14.1 T, 15N-enrichment does not increase carbon-6 T1 but it yields a roughly 3-fold increase in T2. (D) 1 T 13C NMR spectrum of an aqueous equimolar mixture of [6-13C]- and [6-13C,15N3]-arginine, displaying the carbon-6 resonance of each arginine variant. Peak widths were quantified to approximate relative differences in carbon-6 T2*, and the narrower peak widths for [6-13C,15N3]-arginine indicate an increase in T2* with 15N-enrichment. (E) 1 T 13C NMR of HP [6-13C]- and [6-13C,15N3]-arginine acquired with a 30° excitation every 3 s. Scalar-mediated relaxation from adjacent 14N-nuclei results in depolarization of the carbon-6 resonance of [6-13C]-arginine during sample transfer from the polarizer to the spectrometer, whereas this relaxation mechanism is mitigated in [6-13C,15N3]-arginine.
