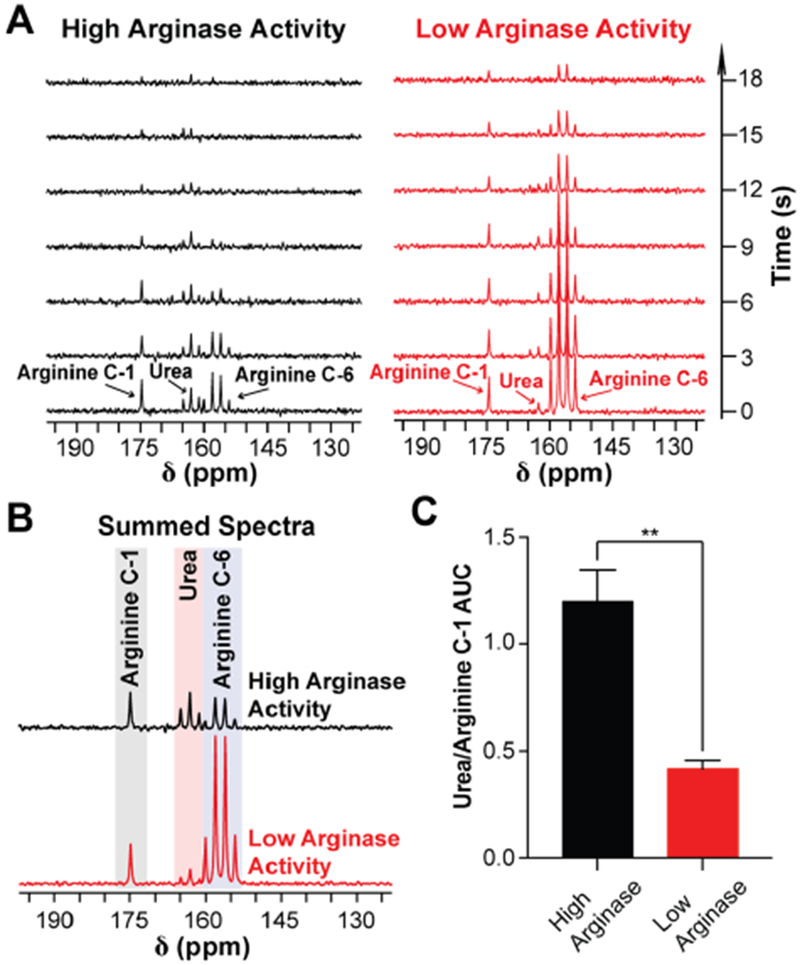
Figure 4.

Arginase-catalyzed hydrolysis of HP [6-13C,15N3]-arginine to [13C,15N2]-urea can be detected with 1 T NMR. (A) 1 T 13C NMR of HP [6-13C,15N3]-arginine mixed with either high levels (left, homogenate containing 10 μg of mouse liver) or low levels (right, homogenate containing 3.3 μg of mouse liver) of arginase activity, demonstrating that HP [13C,15N2]-urea production scales with increasing arginase activity. Spectra were acquired with a 30° excitation every 3 s. (B) Sum of the spectra from (A). (C) Ratio of the urea peak integral with the carbon-1 resonance of arginine from (B). **p < 0.01.
