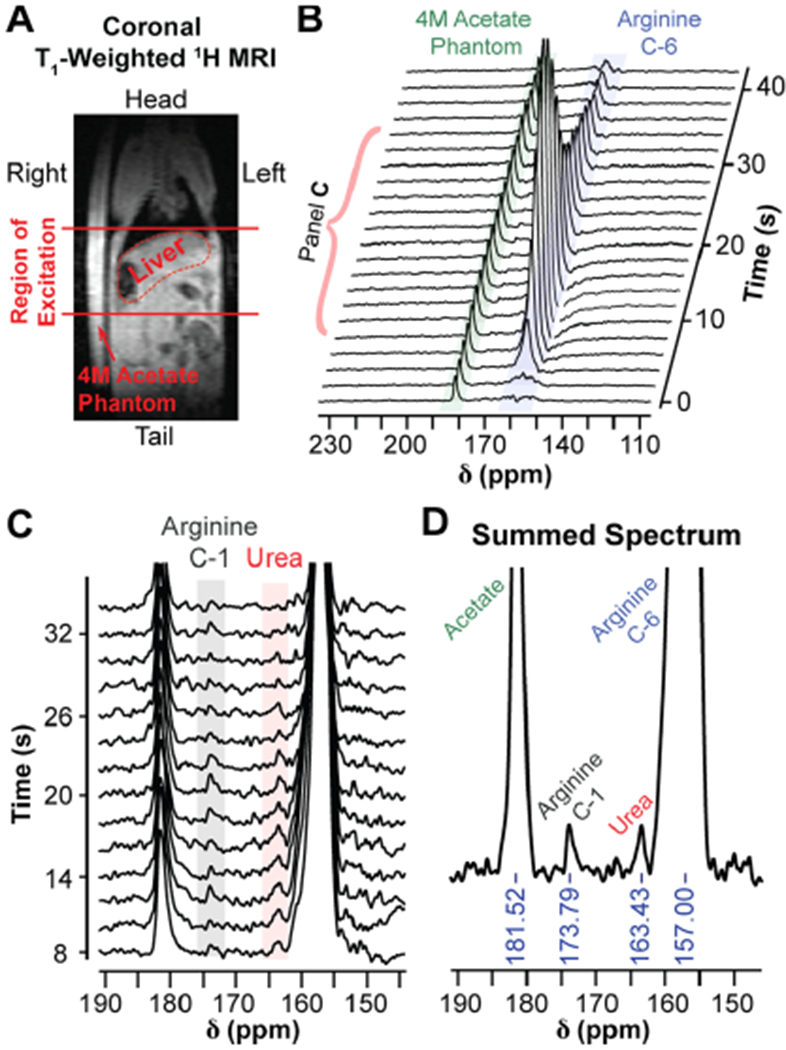
Figure 5.

In vivo detection of liver arginase activity with HP [6-13C,15N3]-arginine. (A) Coronal T1,-weighted 1H-MRI of a female athymic nude mouse placed next to a 4 M [1-13C]-acetate phantom. The 2 cm region of excitation for HP 13C-MRS acquisition is indicated by the solid red lines. (B) 13C-spectra from the 2 cm region indicated in (A) following injection with HP [6-13C,15N3]-arginine, acquired with a 30° excitation every 2 s. The spectra illustrate the accumulation and subsequent signal decay of [6-13C,15N3]-arginine within the excitation slice. (C) Spectra 5–18 from (B), magnified to display the arginine carbon-1 (natural abundance) and urea resonances. The urea resonance is likely from arginase-mediated hydrolysis of hyperpolarized [6-13C,15N3]-arginine in the liver. Spectra have been baseline corrected with cubic splines. (D) Sum of spectra 5–18 from (B). The resulting summed spectrum was baseline corrected with cubic splines.
