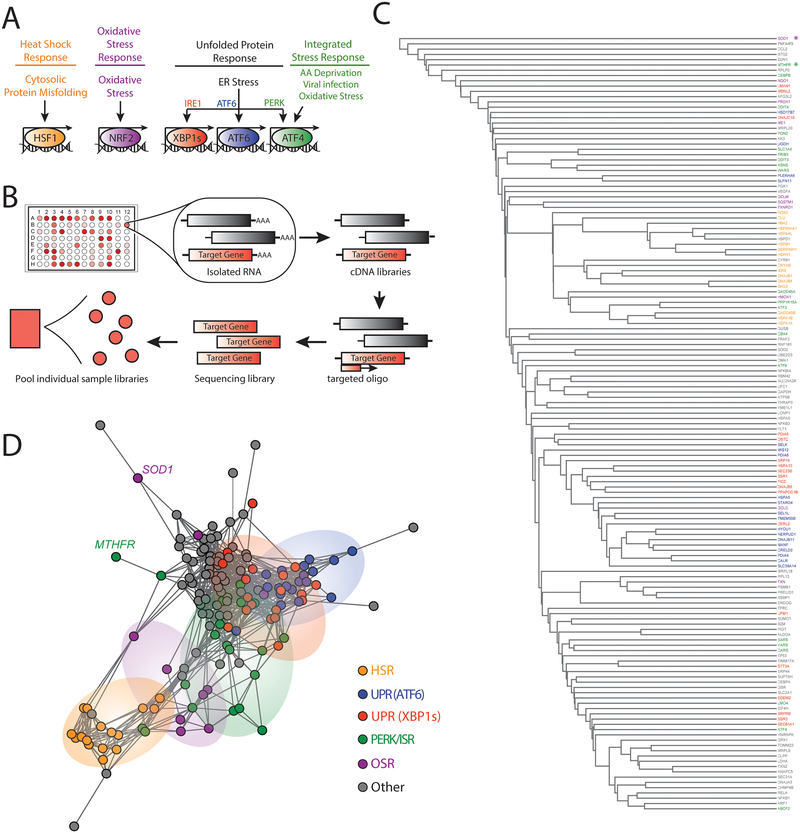
Figure 1. Targeted RNA sequencing deconvolutes stress-responsive transcriptional programs.
A. Illustration showing the stress-responsive proteostasis pathways profiled in our targeted RNAseq assay. Stresses that activate each pathway and specific transcription factors activated downstream of these pathways are also shown.
B. Schematic of the general protocol used for our targeted RNAseq assay. Briefly, RNA is isolated from cells in a 96-well plate format following a given treatment. This RNA is then converted into cDNA libraries that are probed using oligos targeted to specific stress-responsive genes (red) for sequencing library generation. Barcoded sequencing libraries from each individual treatment condition are then pooled for sequencing.
C. Dendrogram of individual target genes from our targeted RNAseq panel (see Table 1) grouped by hierarchical clustering using the Euclidean distance between each genes’ expression level correlation coefficients over all treatment conditions (see Table 2 and Table S1). Genes are colored by assignment to specific stress-responsive signaling pathways to report on activation of the HSR (orange), the OSR (purple), the ATF6 UPR signaling pathway (blue), the IRE1/XBP1s UPR signaling pathway (red), the PERK/ISR signaling pathway (green), or other pathways (grey). The asterisks identify SOD1 (purple) and MTHFR (green).
D. Network graph of individual target genes from our targeted RNAseq panel showing the clustering of genes into defined stress-responsive signaling pathways. This graph is derived by representing each gene as a vertex and connecting the vertices for genes whose expression level changes correlate with Pearson R > 0.6. Genes that do not correlate at this level with any other genes are connected only to the gene with which they have the highest correlation coefficient. Pathways are colored using the same scheme described above in Fig. 1C. SOD1 and MTHFR are identified by name.

