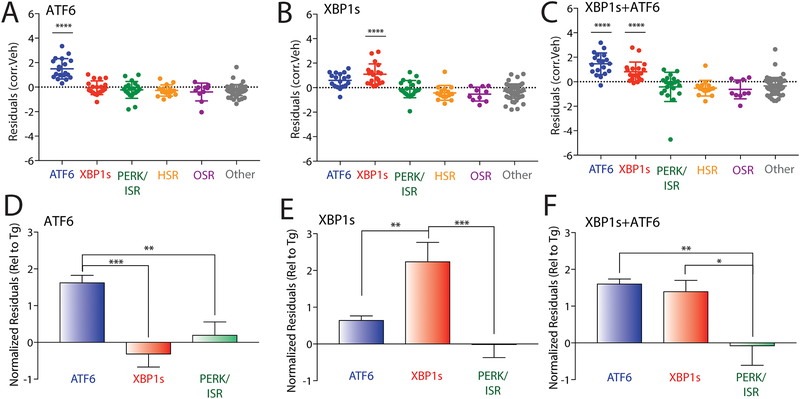
Figure 3. Targeted RNAseq defines stress-independent activation of UPR-associated signaling pathways.
A. Plot showing residuals calculated by comparing the expression of our panel of stress-responsive genes between HEK293DAX cells following treatment with trimethoprim (10 μM 4 h; activates DHFR.ATF6) or vehicle. Calculation of residuals was performed as described in Fig. 2A. Statistics were calculated using one-way ANOVA. Significance shown reflects comparison to “Other” target transcript set. ****p<0.0001. See Table S3 for full ANOVA table.
B. Plot showing residuals calculated by comparing the expression of our panel of stress-responsive genes between HEK293DAX cells following treatment with dox (1 μg/mL 4 h; activates dox-inducible XBP1s) or vehicle. Calculation of residuals was performed as described in Fig. 2A. Statistics were calculated using one-way ANOVA. Significance shown reflects comparison to “Other” target transcript set. ****p<0.0001. See Table S3 for full ANOVA table.
C. Plot showing residuals calculated by comparing the expression of our panel of stress-responsive genes between HEK293DAX cells following treatment with both trimethoprim (10 μM, 4 h; activates DHFR.ATF6) and dox (1 μg/mL 4 h; activates dox-inducible XBP1s) or vehicle. Calculation of residuals was performed as described in Fig. 2A. Statistics were calculated using one-way ANOVA. Significance shown reflects comparison to “Other” target transcript set. ****p<0.0001. See Table S3 for full ANOVA table.
D. Graph showing normalized residuals for genesets regulated by the ATF6 (blue), XBP1s (red) or PERK (green) UPR signaling pathways in HEK293DAX cells following treatment with TMP (10 μM, 4 h; activates DHFR.ATF6). The residuals for each gene were normalized to those observed for thapsigargin (Tg)-induced ER stress in HEK293DAX cells (Fig. S3A,B). Normalized data was subjected to ROUT outlier testing. Statistics from one-way ANOVA **p<0.01, ***p<0.001.
E. Graph showing normalized residuals for genesets regulated by the ATF6 (blue), XBP1s (red) or PERK (green) UPR signaling pathways in HEK293DAX cells following treatment with dox (1μg/mL, 4 h; activates dox-inducible XBP1s). The residuals for each gene were normalized to those observed for thapsigargin (Tg)-induced ER stress in HEK293DAX cells (Fig. S3A,B). Normalized data was subjected to ROUT outlier testing. Statistics from one-way ANOVA **p<0.01, ***p<0.001.
F. Graph showing normalized residuals for genesets regulated by the ATF6 (blue), XBP1s (red) or PERK (green) UPR signaling pathways in HEK293DAX cells following treatment with both TMP (10 μM, 4 h; activates DHFR.ATF6) and dox (1μg/mL, 4 h; activates dox-inducible XBP1s). The residuals for each gene were normalized to those observed for thapsigargin (Tg)-induced ER stress in HEK293DAX cells (Fig. S3A,B). Normalized data was subjected to ROUT outlier testing. Statistics from one-way ANOVA. *p<0.05, **p<0.01.

