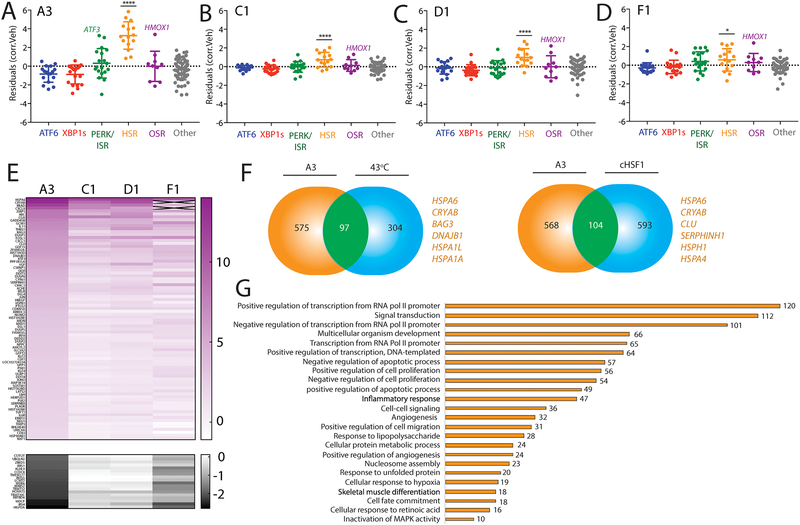
Figure 6. Defining the selectivity for HSF1 activating compounds identified through reporter based HTS.
A. Plot showing residuals calculated by comparing the expression of our stress-responsive gene panel between HEK293T cells treated with compound A3 (10 μM, 4 h) or vehicle. Calculation of residuals was performed as described in Fig. 2A. Genes are grouped by target stress-responsive signaling pathway. Statistics were calculated using one-way ANOVA. Significance shown reflects comparison to “Other” target transcript set. ****p<0.0001. See Table S3 for full ANOVA table.
B. Plot showing residuals calculated by comparing the expression of our stress-responsive gene panel between HEK293T cells treated with compound C1 (10 μM, 4 h) or vehicle. Calculation of residuals was performed as described in Fig. 2A. Genes are grouped by target stress-responsive signaling pathway. Statistics were calculated using one-way ANOVA. Significance shown reflects comparison to “Other” target transcript set. ****p<0.0001. See Table S3 for full ANOVA table.
C. Plot showing residuals calculated by comparing the expression of our stress-responsive gene panel between HEK293T cells treated with compound D1 (10 μM, 4 h) or vehicle. Calculation of residuals was performed as described in Fig. 2A. Genes are grouped by target stress-responsive signaling pathway. Statistics were calculated using one-way ANOVA. Significance shown reflects comparison to “Other” target transcript set. ****p<0.0001. See Table S3 for full ANOVA table.
D. Plot showing residuals calculated by comparing the expression of our stress-responsive gene panel between HEK293T cells treated with compound F1 (10 μM, 4 h) or vehicle. Calculation of residuals was performed as described in Fig. 2A. Genes are grouped by target stress-responsive signaling pathway. Statistics were calculated using one-way ANOVA. Significance shown reflects comparison to “Other” target transcript set. *p<0.05. See Table S3 for full ANOVA table.
E. Heat map of fold-change transcript levels from whole-transcriptome RNAseq (relative to vehicle treated cells) for the 100 genes most significantly altered by A3 treatment in HEK293T cells (82 positive regulation, top; 10 negative regulation, bottom). The changes in these genes are also shown for HEK293T cells treated with C1, D1, and F4 (10uM for 4 hours).
F. Venn diagrams showing overlap of upregulated genes from whole-transcriptome RNAseq of HEK293T cells treated with A3 (10μM 4 hours) and HeLa cells under heat shock (left)6, or dox-inducible cHSF1 (right) in HEK293TREX cells17. Select genes identified in the overlap are highlighted.
G. Numbers of genes from GO analysis of significantly altered transcripts in HEK293T cells treated with compound A3 (10 μM, 4 h) relative to vehicle-treated cells. GO analysis was performed using David61. Entire GO analysis is reported in Supplementary Table S5.

