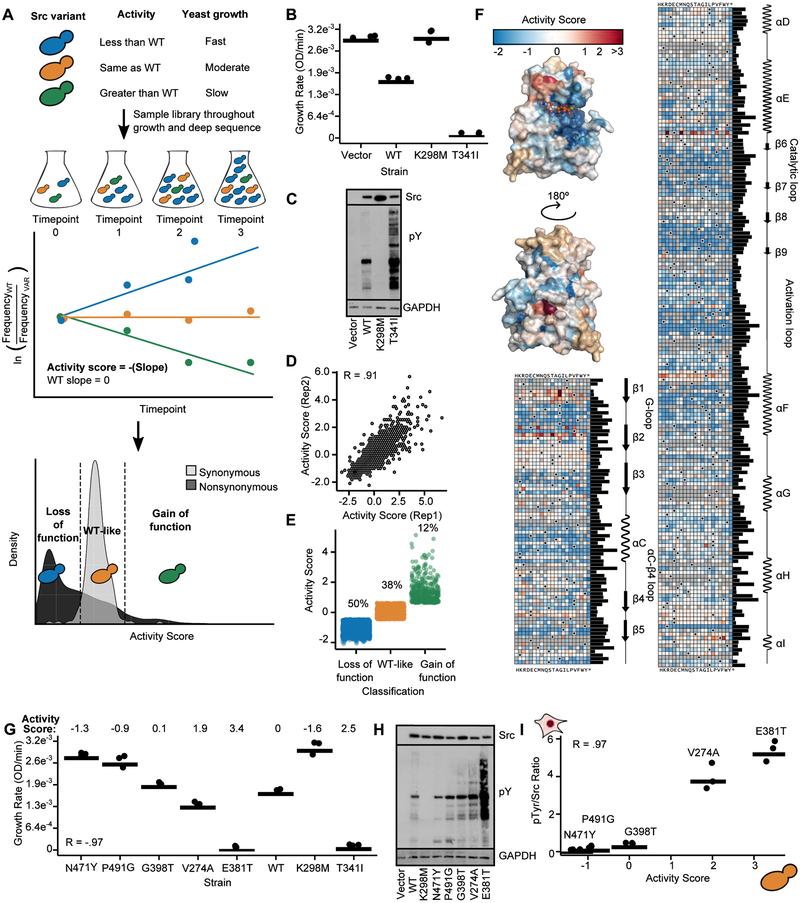
Figure 2. Multiplex measurement of the activity of 3,506 single amino acid Src variants.
A. Schematic of a yeast growth-based deep mutational scan (DMS) of the Src catalytic domain. B. Individually-assessed growth curves for yeast expressing Srcmyr WT, K298M, T341I, or a control vector (n=3). C. Src and phospho-tyrosine (pTyr) immunoblots of yeast expressing Srcmyr variants for 24 hr. D. Scatterplot showing activity score correlations between two independent transformations of the Srcmyr variant library (Pearson’s R = 0.91). E. Activity scores for variants classified as gain-of-function (n=403, green), WT-like (n=1288, orange), or loss-of-function (n=1681, blue). F. Position-averaged activity scores mapped onto the Src catalytic domain (PDB: 3DQW). Nonsense mutants were excluded from the average score. Sequence-activity map of Src catalytic domain. Black dots in the map indicate the WT amino acid, gray tiles indicate missing data. Bar graph indicates relative evolutionary conservation at each position as determined by Kullback-Leibler entropy. Secondary structure and functional motif annotations were obtained from the ProKinO database. G. Dot plot of individually assessed growth rates compared to activity scores for a panel of Srcmyr variants (n=3; Pearson’s R = −.97). Growth rates for WT, K298M, and T341I from Figure 2B are shown for comparison. H. Src and phospho-tyrosine immunoblots of yeast expressing Srcmyr variants. I. Correlation between yeast DMS-derived activity scores and the ratio of phospho-tyrosine/Src levels in HEK293Ts for a panel of Srcmyr variants (n=3; Pearson’s R = 0.97; Figures S1E, S1F). Points represent individual measurements and the horizontal lines indicate the mean of all measurements. See also Figure S1, Tables S2 and S3.

