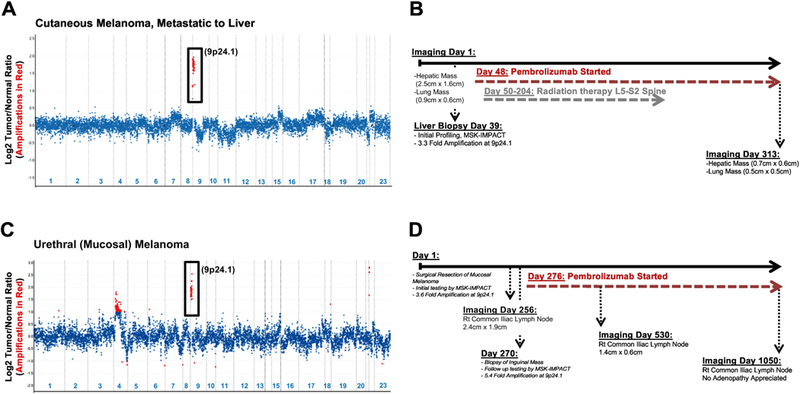
Figure 2: Timeline and Copy Number Assessment in Melanomas with 9p24.1 Amplification.

Copy number plots have been shown for both patients (A: Case 1, cutaneous melanoma metastatic to liver; C: Case 2, urethral melanoma). Relative (Log2) tumor/normal ratios (y-axis) and corresponding chromosomes (x-axis) are displayed, with each blue dot representing an individual probe region. Amplified regions are shown in red. Corresponding timelines detailing key dates pertaining to imaging, molecular testing and immunotherapy has been shown for the cutaneous metastatic melanoma involving the liver (B, Case 1) and the mucosal melanoma (D, Case 2).
