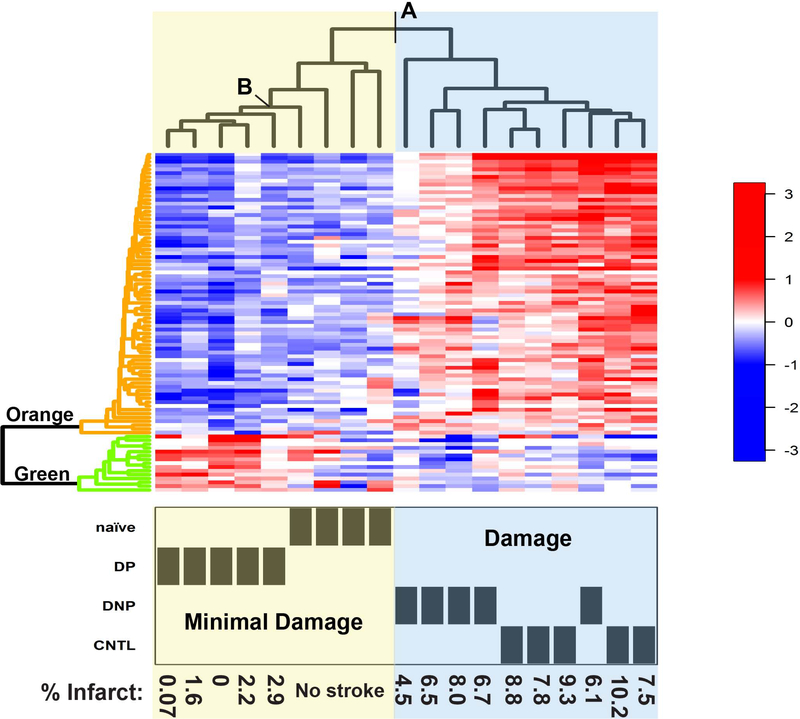
Fig. 3. Heatmap of hierarchical clustering of differentially regulated proteins expressed in the CNS.
Heatmap of individual protein expression levels (key on right) with hierarchical clustering performed using R. Top dendrogram: Individual animals were clustered based on the proteomic expression profiles of proteins identified as differentially regulated by ANOVA (adjusted p value <0.05). Animal groups and infarct size of individual animals are shown at the bottom. A) Point of separation between Minimal Damage and Damage groups. B) Point that differentiates DP group from naïve animals. Left dendrogram: Clustering of proteins delineates into two distinct cluster groups: Orange) High levels in the Damaged animal groups and Green) High levels in the DP Minimal Damage group.

