
Figure 2. Resident Tissue Macrophages are Dynamic First Responders to Tissue Damage.
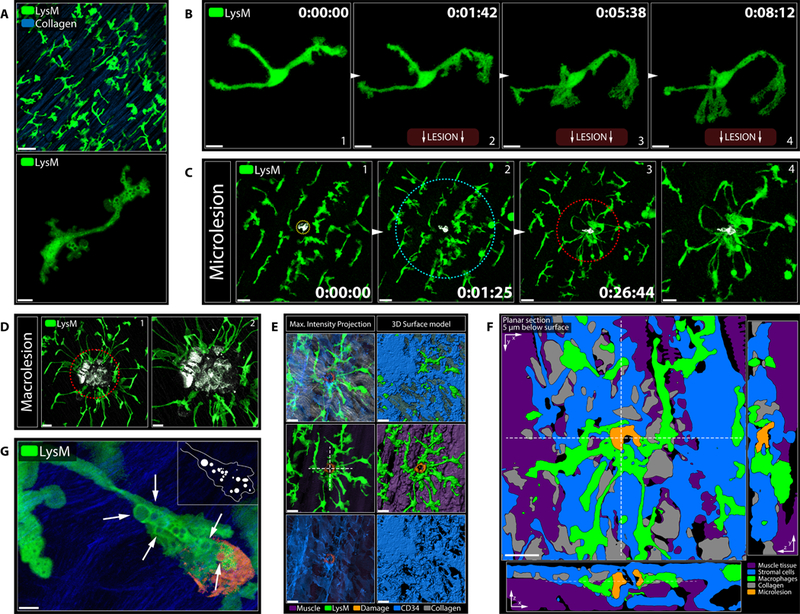
A) Peritoneal serosa (top) and close-up image of an RTM (bottom) under resting conditions. Scale bars, 5 μm (top) and 50 μm (bottom). See Movie S3A.
B) First minutes of an individual RTM (green) responding to a sterile tissue injury (bottom; not shown). Scale bar, 10 μm. See Movie S3B.
C) RTM (green) responding to a microlesion (grey). Image (4) shows (3) in higher magnification. Circles indicate inner (red) and outer (cyan) response zone around the damage. Scale bars, 20 μm (1–3) and 10 μm (4). See Movie S3C.
D) Different magnifications of RTM (green) responding to a macrolesion (grey). Scale bars, 20 μm (left) and 10 μm (right).
E) Cloaking RTM and stromal cells covering a microlesion. Max intensity projection (left); 3D surface model (right). See Data File S2C. Scale bar, 20 μm. Dashed cross marks cross section in Figure 2F. Representative of > 5 experiments.
F) Planar cross sections of 3D object in Figure 2E. See Data File S2D. Scale bar, 20 μm.
G) Large endosomes (arrows) in a cloaking RTM (green) at a microlesion (orange). Scale bar, 5 μm.