
Figure 4. Sequential Sensing of Damage-Associated Alarmins Drives Cloaking.
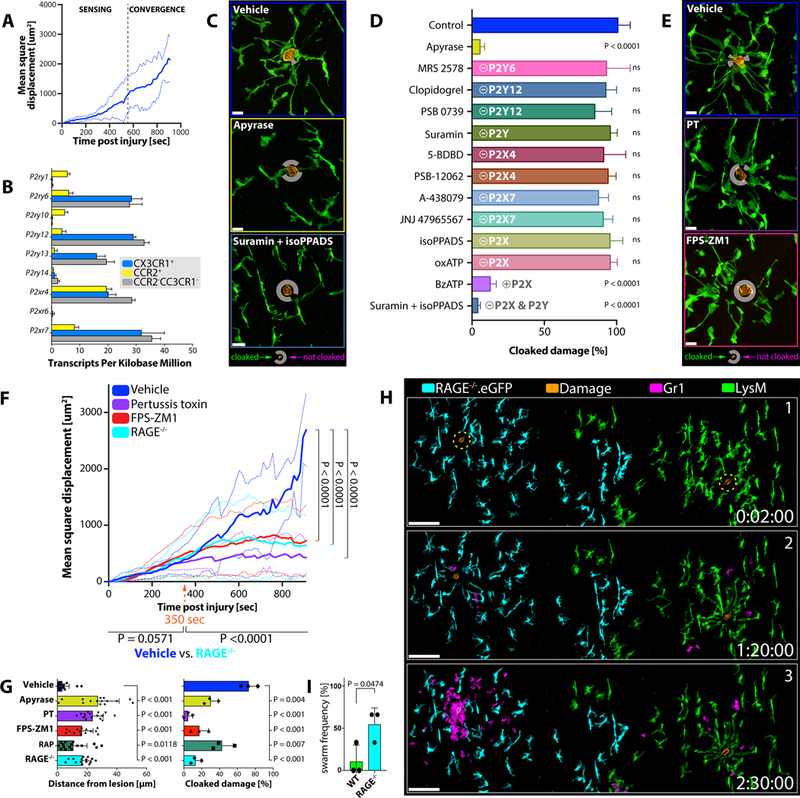
A) Mean square displacement of individual RTM pseudopods moving towards a micro-lesion over time. Data pooled from three independent tracking experiments. See Figure S4A–S4B.
B) P2 receptor expression in different phagocyte populations isolated from peritoneal tissues of Cx3cr1gfp/+Ccr2rfp/+ mice (n = 3). Normalized reads per kilobases; means ± SEM.
C) RTM (green) responses 30 minutes after damage induction (orange) in mice pre-treated with vehicle (top), apyrase (mid) or suramin/isoPPADS (bottom). n = 3–5 animals per group with 2–3 lesions per mouse. Scale bar, 15 μm. White circles mark un-cloaked areas.
D) Comparison of RTM cloaking capacities upon inhibitor treatment. n = 2–3 animals per group with 2–3 lesions per mouse. One-way ANOVA; each condition compared to the naïve control; means ± SEM.
E) RTM (green) responses 30 minutes after damage (orange) induction in mice treated with vehicle (top), PT (mid) or FPS-ZM1 (bottom). n = 3–5 animals per group with 2–3 lesions per mouse. Scale bar, 15 μm.
F) Mean square displacement of individual RTM pseudopods moving towards a microlesion in WT mice treated with vehicle (blue), FPS-ZM1 (red) or pertussis toxin (purple), and RAGE−/−(cyan) mice over time. Data pooled from three independent tracking experiments for each condition. Two-way ANOVA; means ± SEM. See Figure S4C.
G) Distances of pseudopods to microlesions (left) and physically cloaked area (right; pooled data from three independent experiments) 30 minutes after damage induction in WT mice treated with vehicle (blue), apyrase (yellow), pertussis toxin (PT; purple), FPS-ZM1 (red) or RAGE Antagonist Peptide (RAP; green), or RAGE−/−(cyan) mice. Two-way ANOVA; means ± SEM. See Figure S4C.
H) Responses of wildtype RTM (green) versus RAGE−/−.eGFP RTM (cyan) to simultaneously induced microlesions (orange) and subsequent neutrophil behavior (magenta). See Figure S4D. Scale bar, 100 μm. Representative of 3 experiments with 3 sets of lesions per mouse.
I) Frequency of neutrophil swarm initiations in wild type (WT) versus RAGE-deficient (RAGE−/−) areas. Unpaired t test; n = 3 animals per group with 3 lesion sets per mouse; means ± SEM.