
Figure 6. Axonogenesis of Ptbp2−/− neurons is disorganized in vitro.
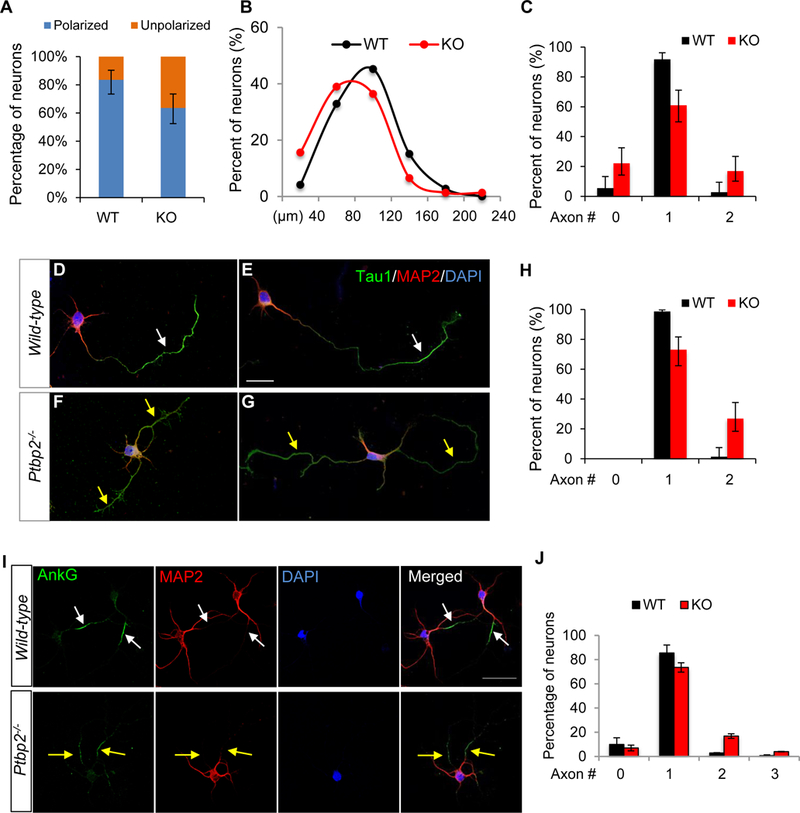
(A) A larger percentage of Ptbp2−/− (KO) neurons than WT neurons are unpolarized. The polarity index, i.e., the length of the longest neurite in relative to the length of the 2nd longest neurite, classifies polarized neurons (index ≥ 2) and unpolarized neurons (index < 2). N = 73 (WT) and 77 (KO) neurons. P value = 0.0047, Fisher’s exact test. Error bars represent 95% confidence intervals. (B) Density plot shows the longest protrusions in KO are shorter than those in WT neurons. P = 0.00259, Wilcoxon test. (C) More KO neurons than WT neurons display two axon-like processes (P value = 0.0034) and zero axon (P value = 0.0029), Fisher’s exact test. Neurites longer than 50 µm are classified as axons. Error bars represent 95% confidence intervals. (D-G) Immunostaining of axon marker Tau1 and dendrite marker MAP2 in WT (D-E) and Ptbp2−/− (F-G) neurons. Arrows point to Tau1+ MAP2- axons. (H) More KO neurons display two Tau1+ MAP2- axon-like processes. Error bars represent 95% confidence intervals. P value <0.0001, Fisher’s exact test. (I) Immunostaining of AIS marker AnkG and dendrite marker MAP2 in WT and Ptbp2−/− DIV 5 neurons. Arrows point to AnkG+ MAP2- axons. White: single axon. Yellow: surplus axons. (J) Quantification of axon numbers based on AnkG+ MAP2- staining. N = 247 (WT) and 228 (KO). Data are represented as mean ± SEM of 3 animals of 3 liters. P = 0.0009 for 2-axons and 0.0054 for 3-axons, Student’s t-test. See also Figure S8.