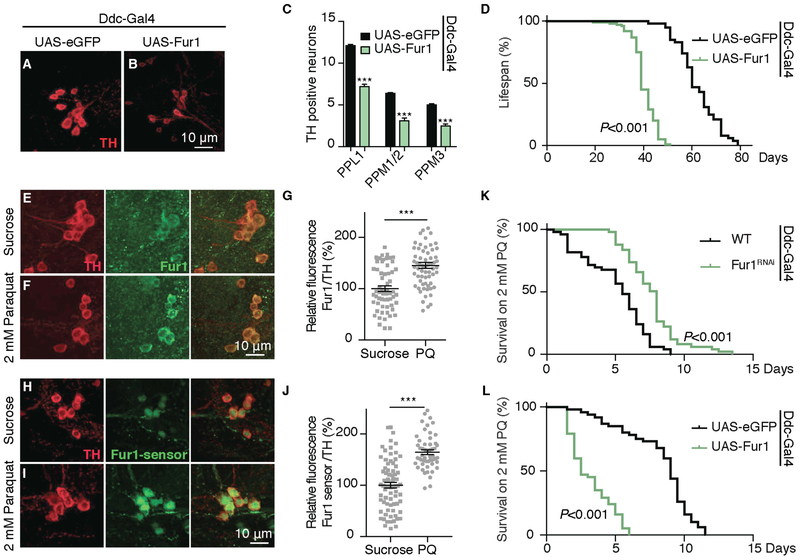
Figure 3. Fur1 is Neurotoxic.
(A and B) Representative images of DA neurons stained with anti-TH antibody (red) from PPL1 clusters in 35 day-old female flies of the following genotypes: (A) UAS-eGFP (Ddc-Gal4/+; UAS-eGFP/+) and (B) UAS-Fur1 (Ddc-Gal4/UAS-eGFP::Fur1).
(C) Quantification of the number of TH-positive DA neurons in the PPL1, PPM1-2, and PPM3 clusters for genotypes in (A) and (B). n = 22 hemispheres for each genotype. Data are represented as mean ± SEM. One-way ANOVA with Bonferroni post-test.
(D) Representative lifespan curves for genotypes in (A) and (B). n = 100 female flies for each genotype (see also Table S1). Log-rank and Wilcoxon tests.
(E and F) PPL1 clusters double stained with anti-TH (red) and anti-Fur1 (green) in (yw) flies raised on (E) sucrose or (F) 2 mM paraquat-containing medium.
(G) Quantification of Fur1 fluorescence intensity relative to TH for conditions in (E) and (F). Each data point represents fluorescence from a single neuron. n = 70 neurons from 7 PPL1 clusters for each genotype. Data are represented as mean ± SEM. Student’s t test.
(H and I) PPM1-2 clusters stained with anti-TH (red) in Fur1 sensor (UAS-Fur1-sensor/+; Ddc-Gal4/+) flies raised on (H) sucrose or (I) 2 mM paraquat containing medium. GFP corresponding to Fur1 sensor (green) is directly imaged without antibody staining.
(J) Quantification of Fur1 sensor fluorescence intensity relative to TH for conditions in (H) and (I). Each data point represents fluorescence from a single neuron. n = 50 neurons from 10 PPM1-2 clusters for each genotype. Data are represented as mean ± SEM. Student’s t test.
(K) Representative survival curves for WT (wild-type) female flies (DDC-Gal4/+) and Fur1RNAi flies (Ddc-Gal4/+; UAS-Fur1-RNAi/+) raised on 2 mM paraquat-containing medium. Flies were transferred at 5 days to paraquat-containing medium. n = 100 female flies for each genotype (see also Table S1). Log-rank and Wilcoxon tests.
(L) Representative survival curves for female flies of the genotypes in (A) and (B) raised on 2 mM paraquat-containing medium. n = 100 female flies for each genotype (see also Table S1). Log-rank and Wilcoxon tests.
*p < 0.05, **p < 0.01 ***p < 0.001.

