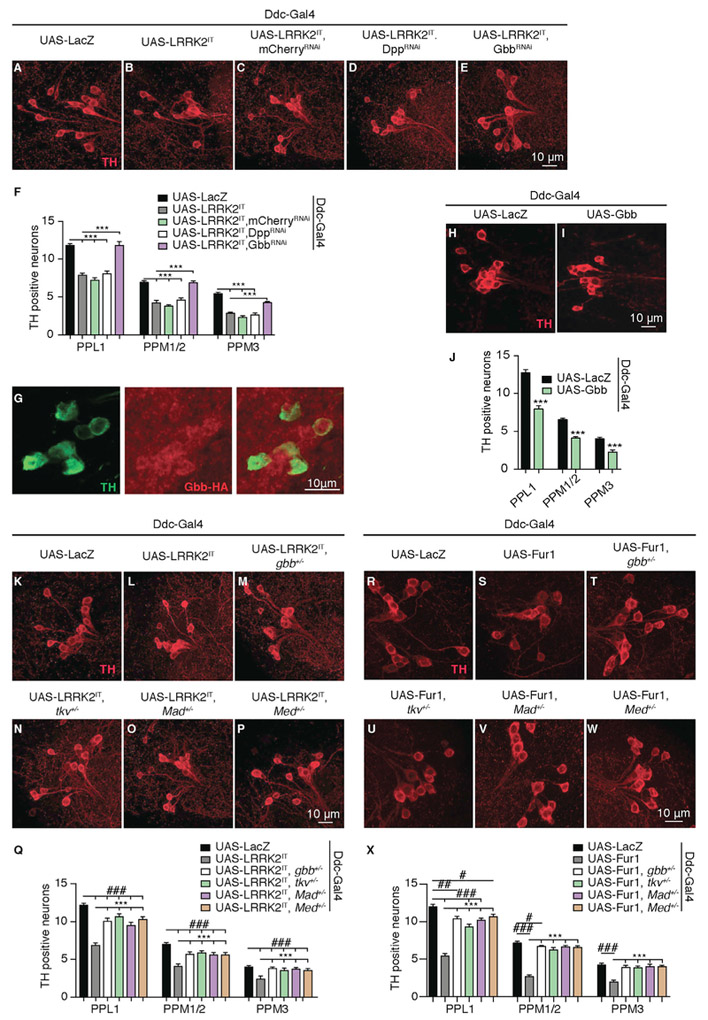
Figure 4. LRRK2 Toxicity Is Mediated by BMP Signaling.
(A–E) Representative images of DA neurons stained with anti-TH antibody (red) from PPL1 clusters in 60 day-old female flies of the following genotypes: (A) UAS-LacZ (Ddc-Gal4/UAS-LacZ), (B) UAS-LRRK2IT (Ddc-Gal4/+; UAS-LRRK2IT/+), (C) UAS-LRRK2IT, mCherryRNAi (Ddc-Gal4/+; UAS- LRRK2IT/UAS-mCherry-RNAi),
(D) UAS-LRRK2IT, DppRNAi (Ddc-Gal4/+; UAS- LRRK2IT/UAS-Dpp-RNAi), and (E) UAS-LRRK2IT, GbbRNAi (Ddc-Gal4/+; UAS- LRRK2IT/UAS-Gbb-RNAi).
(F) Quantification of the number of TH-positive DA neurons in the PPL1, PPM1-2, and PPM3 clusters for genotypes in (A)–(E). n = 22 hemispheres for each genotype. Data are represented as mean ± SEM. One-way ANOVA with Bonferroni post-test.
(G) Neurons from the PPL1 clusters in a 10-day-old female Drosophila brain (Gbb-HA) double stained with anti-TH (green) and anti-HA (red).
(H and I) Representative images of DA neurons stained with anti-TH antibody (red) from PPL1 clusters in 60-day-old female flies of the following genotypes: (H) UAS-LacZ (Ddc-Gal4/UAS-LacZ) and (I) UAS-Gbb (Ddc-Gal4/+; UAS-Gbb-GFP/+).
(J) Quantification of the number of TH-positive DA neurons in the PPL1, PPM1-2, and PPM3 clusters for genotypes in (H) and (I). n = 22 hemispheres for each genotype. Data are represented as mean ± SEM. One-way ANOVA with Bonferroni post-test.
(K–P) Representative images of DA neurons stained with anti-TH antibody (red) from PPL1 clusters in 60 day-old female flies of the following genotypes: (K) UAS-LacZ (Ddc-Gal4/UAS-LacZ), (L) UAS-LRRK2IT (Ddc-Gal4/+; UAS-LRRK2IT/+), (M) UAS- LRRK2IT, gbb+/− (Ddc-Gal4/gbb1 UAS- LRRK2IT/+), (N) UAS- LRRK2IT, tkv+/− (Ddc-Gal4/tkv7; UAS- LRRK2IT/+), (O) UAS- LRRK2IT, Mad+/− (Ddc-Gal4/Madk00237; UAS- LRRK2IT/+), and (P) UAS- LRRK2IT, Med+/− (Ddc-Gal4/+; UAS- LRRK2IT/MedC246).
(Q) Quantification of the number of TH-positive DA neurons in the PPL1, PPM1–2, and PPM3 clusters for genotypes in (K) to (P). n = 22 hemispheres for each genotype. Data are represented as mean ± SEM. One-way ANOVA with Bonferroni post-test.
(R–W) Representative images of DA neurons stained with anti-TH antibody (red) from PPL1 clusters in 60 day-old female flies of the following genotypes: (R) UAS-LacZ (UAS-LacZ/+; Ddc-Gal4/+), (S) UAS-Fur1 (UAS-eGFP::Fur1/+; Ddc-Gal4/+), (T) UAS- Fur1, gbb+/− (UAS-eGFP::Fur1/gbb1; Ddc-Gal4/+), (U) UAS- Fur1, tkv+/− (UAS-eGFP::Fur1/tkv7; Ddc-Gal4/+) (V) UAS- Fur1, Mad+/− (UAS-eGFP::Fur1/MadK00237; Ddc-Gal4/+), and (W) UAS- Fur1, Med+/− (UAS-eGFP::Fur1/+; Ddc-Gal4/ MedC246).
(X) Quantification of the number of TH-positive DA neurons in the PPL1, PPM1-2, and PPM3 clusters for genotypes in (R)–(W). n = 22 hemispheres for each genotype. Data are represented as mean ± SEM. One-way ANOVA with Bonferroni post-test.
***p < 0.001, #p < 0.05; ##p < 0.01, ###p < 0.001.

