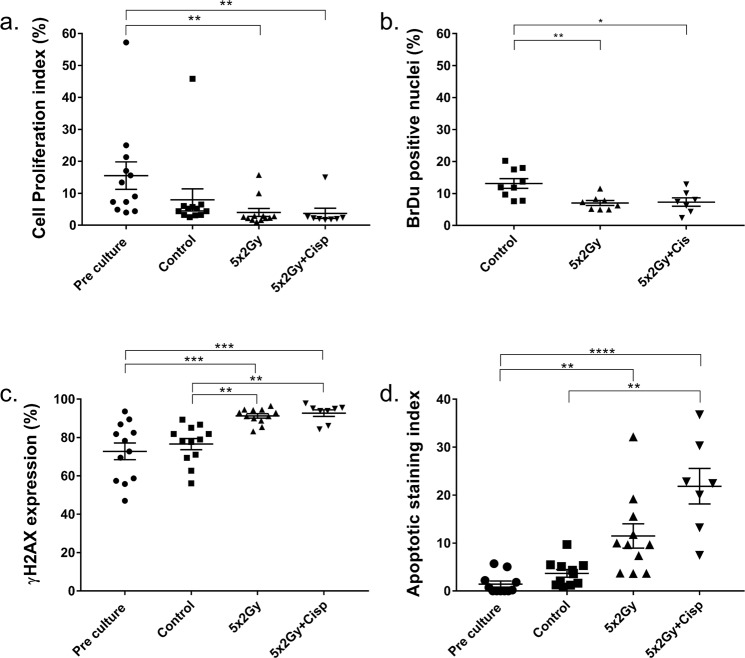
Figure 5.
Immunohistochemical analysis of treated HNSCC PCTS. (a) Cell proliferation index (%) of the tissue, Ki67 positive nuclear area/total nuclear area x100. (Pre, control, 5 × 2 Gy n = 12, 5 × 2 Gy + cisplatin n = 8, Kruskal-Wallis). (b) BrdU positive nuclei (%; control n = 9, 5 × 2 Gy n = 8, 5 × 2 Gy + cisplatin n = 7, One-way ANOVA). (c) DNA damage response by positive γH2AX staining (Pre, control, 5 × 2 Gy n = 12, 5 × 2 Gy + cisplatin n = 8, One-way ANOVA). (d) Caspase cleaved cytokeratin 18 (Apoptotic index) by M30 antibody staining (Pre, control, 5 × 2 Gy n = 11, 5 × 2 Gy + cisplatin n = 7, Kruskal-Wallis). Mean + SEM shown. *p < 0.05 **p < 0.01 ***p < 0.001 ****p < 0.0001.

