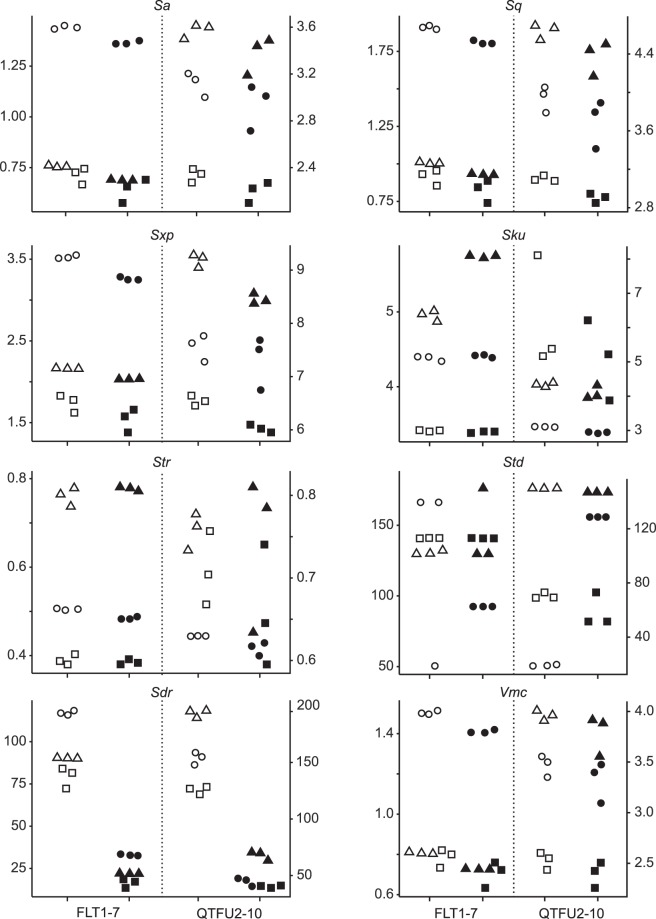
Figure 1.
Scatter plots of the selected ISO 25178 parameters: Sa, Sq, Sxp, Sku, Str, Std, Sdr and Vmc. For each plot, the left y-axis relates to FLT1-7 (flint) and the right y-axis corresponds to QTFU2-10 (quartzite). Symbols differentiate the three locations on each sample (○ = location 1, Δ = location 2 and □ = location 3), empty symbols represent data acquired with the 50×/0.75 objective, and filled symbols correspond to data from the 50×/0.95 objective. See Supplementary Table S1 for details on parameters.

