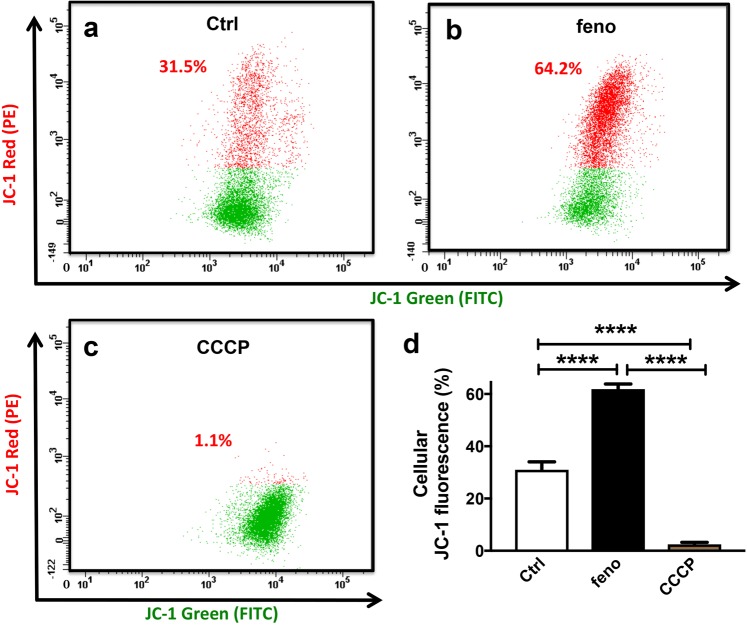
Figure 4.
Hyperpolarized mitochondria in fenofibrate-treated MS1 VEGF angiosarcoma cells. Data were generated by flow cytometry in MS1 VEGF angiosarcoma cells using the mitochondrial membrane potential indicator dye JC-1. (a–d) Example experiment showing the effect of a 48-hour treatment with DMSO (Ctrl) or 50 μM fenofibrate on JC-1 red fluorescence (a,b). The mitochondrial depolarizing agent CCCP was used as a positive control (c). (d) Mean data for experiments exemplified in a-c (n = 4). ****P < 0.0001 (one-way ANOVA followed by Tukey’s multiple comparisons test).

