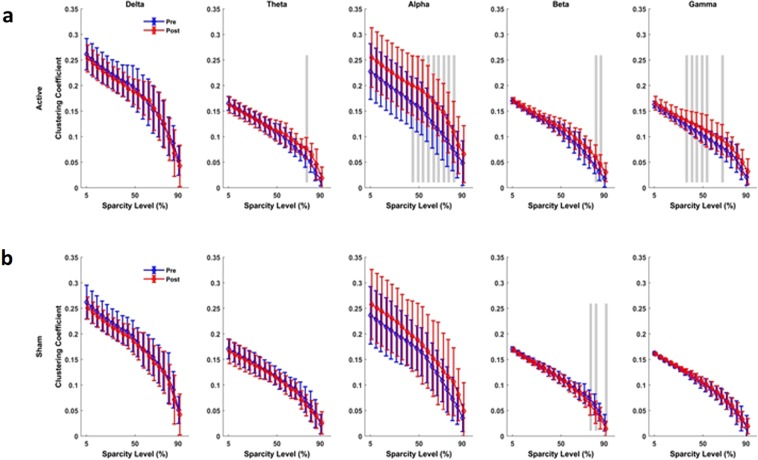
Figure 5.
Connectivity assessment using Clustering coefficient (CC). (a) Active tPBM caused index significantly changed CC for wide range of 45–80% sparsity levels in the alpha band, and 35–55% sparsity levels in the gamma band. (b) Sham tPBM did not caused significant change in CC index, but beta at 75, 82 and 90% of sparsity levels. Blue and red lines line indicate pre and post conditions, respectively. The gray lines indicate a significant difference (p < 0.01) at a certain sparsity level.

