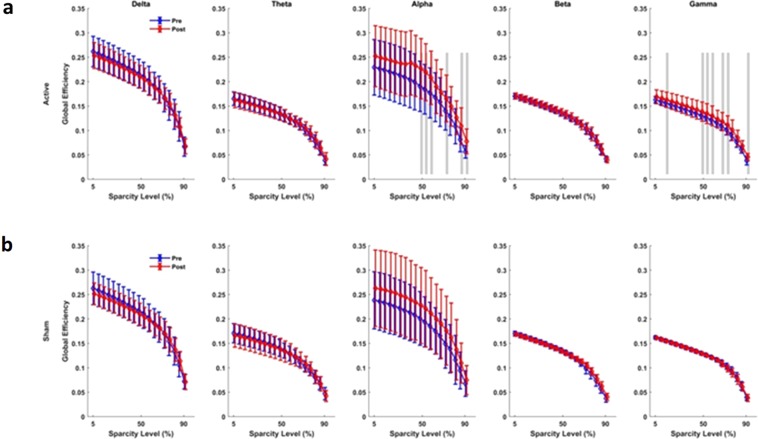
Figure 8.
Connectivity assessment using Global Efficiency measure. (a) Active tPBM caused significant changes in network global efficacy in the alpha band for 50–60%, 75%, 85–90% of sparsity levels, in the gamma band for 15%, 50–60%, 70–75% and 90% of sparsity levels. (b) Sham tPBM did not cause any significant change in the global efficacy. Blue and red lines line indicate pre and post conditions, respectively. The gray lines indicate a significant difference (P < 0.01) at a certain sparsity level.

