
Figure 3.
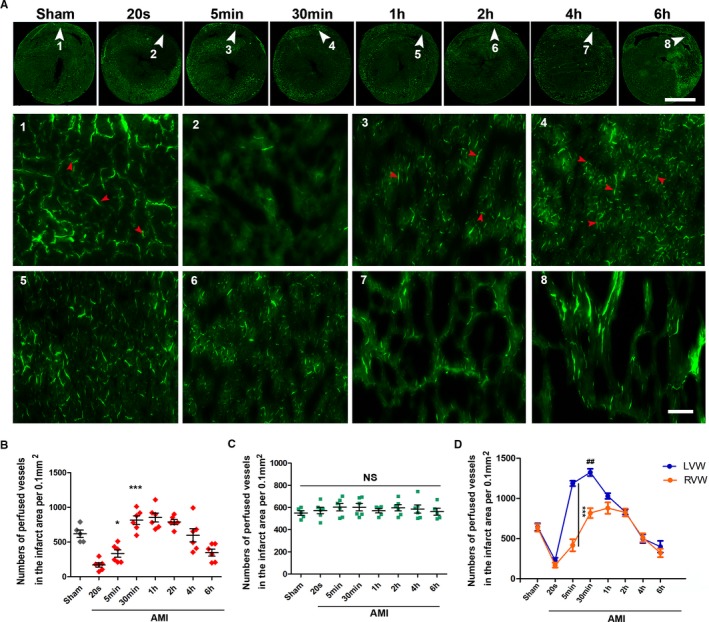
Inhomogeneous distribution of CCMR in rat hearts. A, Lectin‐FITC perfusion experiment was conducted in rats to mark vessels with blood perfusion at 20 seconds, 5 minutes, 30 minutes, 1 hour, 2 hours, 4 hours, and 6 hours ligation of RCA (n=5–6); scale bar (upper)=5 mm; bar (lower)=50 μm. White arrows are the selected representative area; red arrows indicate perfused microvessels labeled by lectin‐FITC. B and C, Quantification of vessels with blood perfusion in infarction zone (right ventricular wall; RVW) and relative normal region (left ventricular wall; LVW); values are means±SD; *P<0.05 vs the 20‐second group; ***P<0.001 vs the sham group. D, Comparison of CCMR in LVW and RVW; ***P<0.001 vs indicated group; ## P<0.05 vs the 1‐hour group (orange). AMI indicates acute myocardial infarction; CCMR, coronary collateral microcirculation reserve; NS, not significant; RCA, right coronary artery.