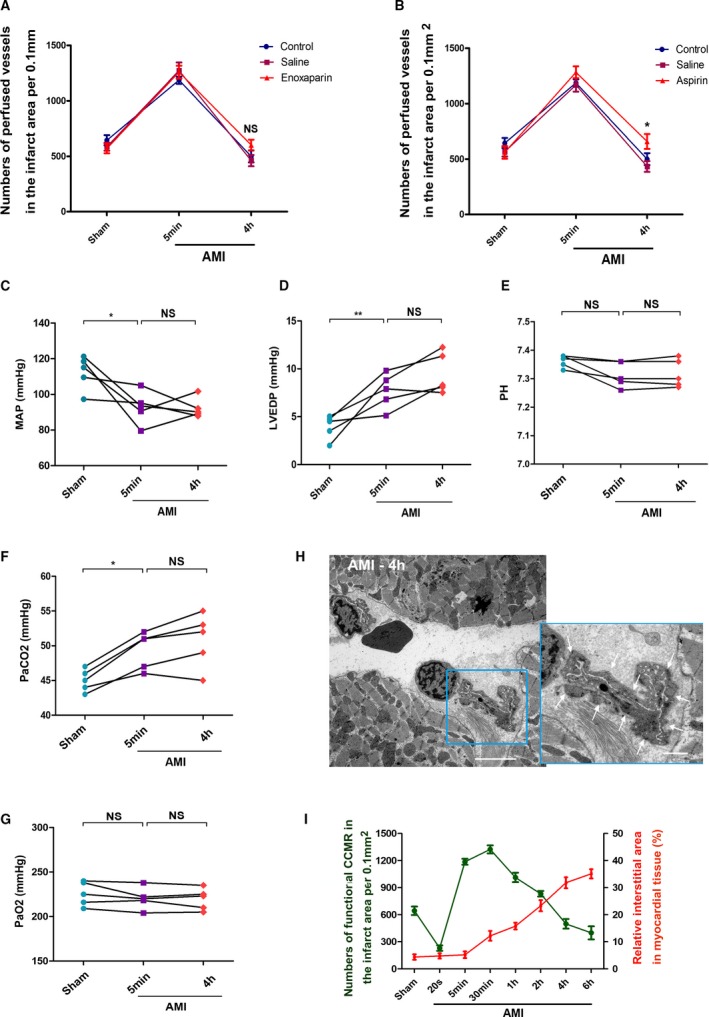
Figure 7.

Possible causes of severe recession of the native collateral blood flow. A, Enoxaparin treatment, NS; P>0.05 vs the control group (n=5–7). B, Aspirin treatment; *P<0.05 vs the control group (n=5–7). C, Mean arterial pressure (n=5). D, Left ventricular end diastolic pressure; data are expressed as the means±SEM. *P<0.05; **P<0.01, NS; P>0.05 vs the indicated groups (n=5). E, pH value. F, Partial pressure of carbon dioxide (PaCO 2). G,PaO2, *P<0.05, NS; P>0.05 vs the indicated groups (n=5). H, TEM for myocardial tissue in the infarct area (AMI 4 hours); white arrows indicate the pressure of interstitial edema on blood vessels. I, A correlation analysis on the relationship between degree of interstitial edema and function of CCMR in the left ventricular wall; bar (left)=5 μm; bar (right)=1 μm. AMI indicates acute myocardial infarction; CCMR, coronary collateral microcirculation reserve; NS, not significant.
