
Figure 3.
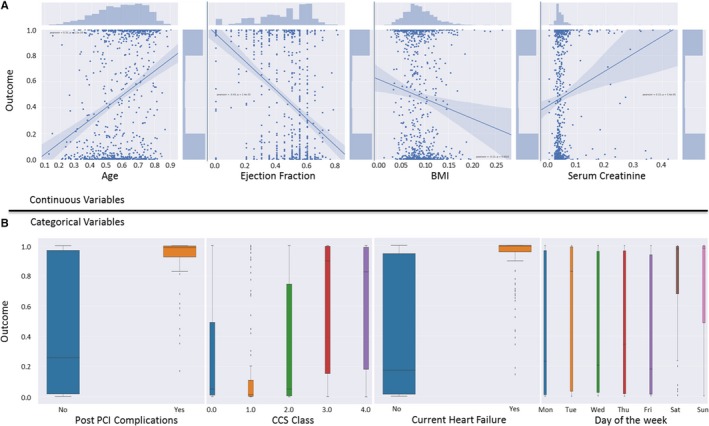
Trend comparison between model outcome and clinically important features. Clinically important categorical and continuous features were plotted to understand their underlying trends in relation to the model outcome. A, Continuous variables have been plotted in a joint scatter and regression plot. The underlying trend between variables and the model outcome is shown for each variable. Normalized values for each variable are plotted on the x‐axis. B, Categorical variables have been plotted using box plot. BMI indicates body mass index; CCS, Canadian Cardiovascular Society; PCI, percutaneous coronary intervention.