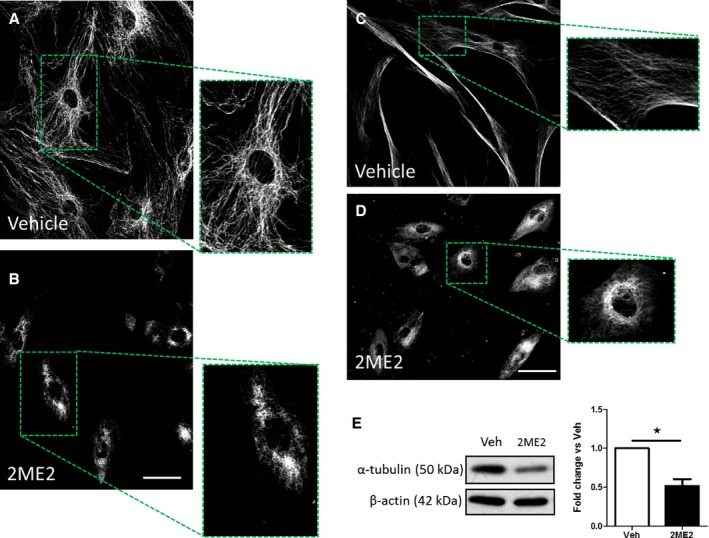
Figure 6.

Assessment of α‐tubulin organization and expression after treatment with 2ME2. α‐tubulin cellular localization in female rat PASMCs (A) and after 2ME2 (10 μmol/L, 24 hours) (B); α‐tubulin cellular localization in female hPASMCs (C) and after 2ME2 (10 μmol/L, 24 hours) (D). Effect of 2ME2 (10 μmol/L, 24 hours) on protein expression levels of α‐tubulin protein expression in female hPASMCs (E). Data are shown as mean±SEM. *P<0.05. Statistical analysis: Panel E determined by paired t‐test. Scale bar indicates 50 μm. 2ME2 indicates 2‐methoxyestradiol; hPASMCs, human pulmonary arterial smooth muscle cells; PASMCs, pulmonary arterial smooth muscle cells; Veh, vehicle.
