
Figure 2.
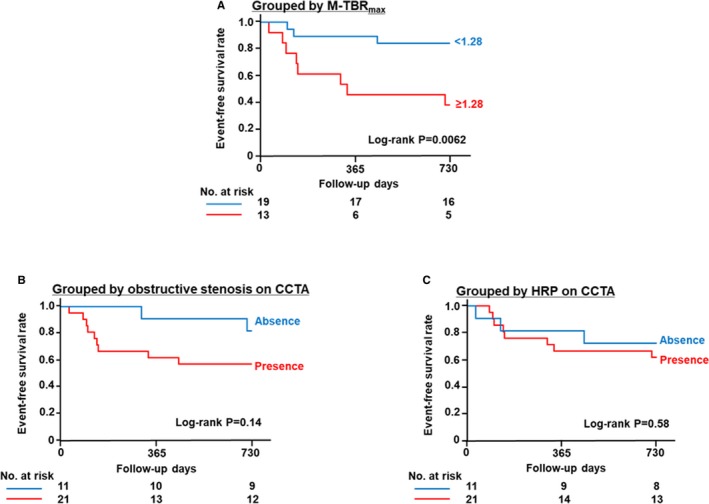
Kaplan–Meier curves for coronary events stratified according to patient‐based 18F‐sodium fluoride (18F‐NaF) TBR max (A), presence or absence of obstructive stenosis on CCTA (B), and presence or absence of HRP on CCTA (C). Patients with maximum TBR max ≥1.28 in any coronary atherosclerotic lesion (M‐TBR max) had poorer outcomes than those with lower values (P=0.0062 by log‐rank test) (A). Patients with obstructive coronary stenosis (P=0.14) (B) and those with HRP (P=0.58) (C) did not have poorer outcomes than patients without those findings. CCTA indicates coronary computed tomography angiography; HRP, high‐risk plaque; TBR max, maximum tissue:background ratio.