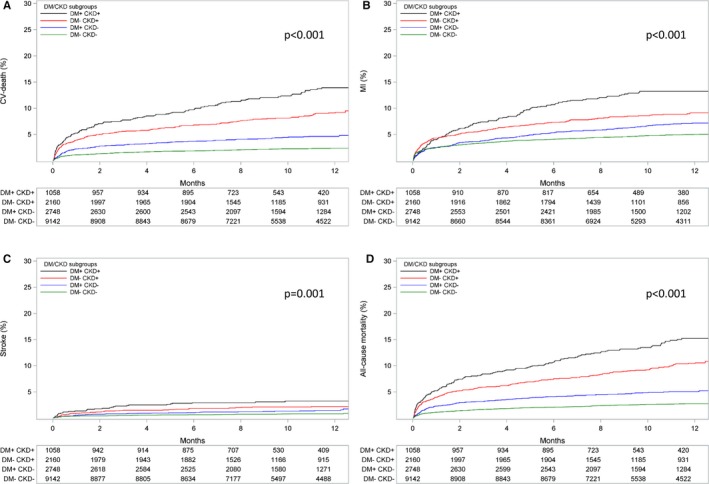
Figure 2.

Kaplan–Meier event rate curves for the cumulative incidence of (A) cardiovascular (CV) death, (B) myocardial infarction (MI), (C) stroke, and (D) all‐cause mortality stratified by DM/CKD status. P value represents the overall comparison among groups according to DM/CKD status. The model is adjusted for age, sex, body mass index, heart rate, prior myocardial infarction, hypertension, dyslipidemia, angina pectoris, smoking status, previous percutaneous coronary intervention or coronary artery bypass graft, type of acute coronary syndrome, and randomized treatment. CKD indicates chronic kidney disease; DM, diabetes mellitus.
