
Figure 3.
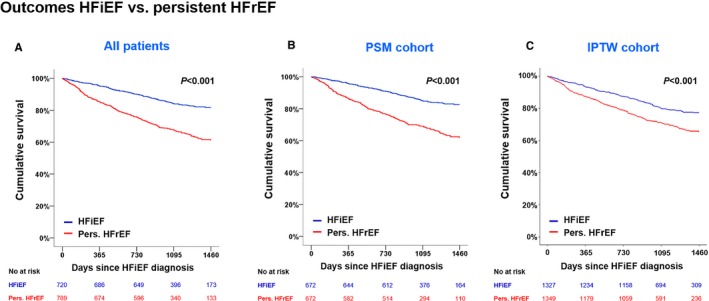
Clinical outcomes according to HFiEF and persistent HFrEF. A, Kaplan–Meier survival curves for 4‐year mortality according to HF phenotypes. As sensitivity analyses, the PSM cohort (B) and the IPTW cohort (C) were also analyzed. The curves are left‐truncated at 4 years after index admission. HFiEF, heart failure with improved ejection fraction; HFrEF, heart failure with reduced ejection fraction; IPTW, inverse‐probability treatment weighted; PSM, propensity score matching.