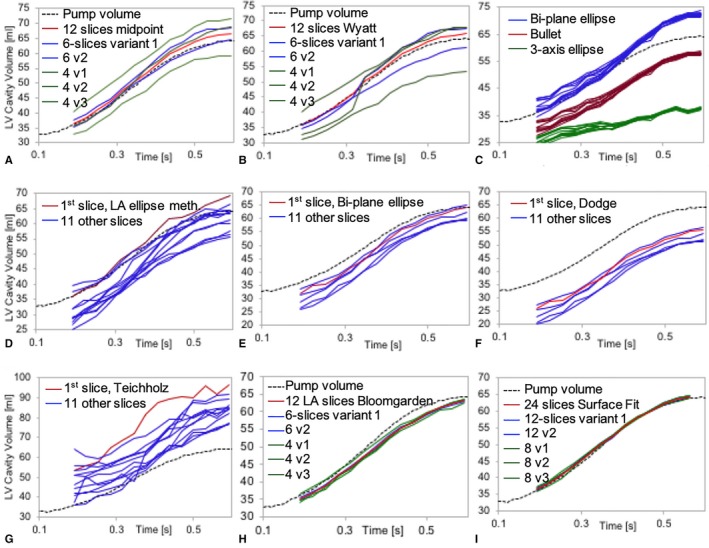
Figure 7.

Left ventricular (LV) volume estimates over time for each method and their slice variants. Each plot shows estimated LV volume (mL) on the vertical axis vs over time (seconds) relative to the ground‐truth (dotted black curve). A, Uses the composite midpoint integration method (Eqn. 1) and (B) uses the Wyatt's modified midpoint method (Eqn. 2) when using all 12 short‐axis slices (red), 2 variants of 6 slices (blue), and 3 variants of 4 slices (green). C, The long‐axis bi‐plane ellipse (Eqn. 3—red), bullet (Eqn. 4—blue), and 3‐axis ellipse methods (Eqn. 5—green) where each curve represents running the method independently on each of the 12 long‐axis (LA) slices. D, The long‐axis‐only ellipse method (Eqn. 6), (E) the bi‐plane long‐axis area‐length method (Eqn. 7), (F) shows the Dodge‐Sandler correction (Eqn. (8)), and (G) the Teichholz method (Eqn. (9)), where each curve represents running the method independently on each of the 12 LA slices and red indicates the 4‐chamber view slice. H, The results using the Bloomgarden (Eqn. (10)) method using all 12 LA slices (red), 2 variants of using 6 slices (blue), and 3 variants of using 4 slices (green). I, The surface fitting (Eqn. (11)) results using all 12 short‐ and 12 long‐axis slices (red), 2 variants of 6 slices in each view (blue), and 3 variants of 4 slices each (green).
