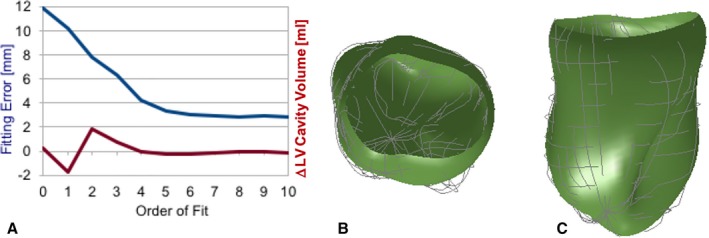
Figure 8.

Left ventricular (LV) endocardial surface fitting results at time frame zero (representing end‐systole—the most convoluted state). A, Plots in blue are the SD error between the LV contour point data and surface model estimates vs the order of fitting using Equation (11). Plotted in red is the difference from the mean of the estimated LV cavity volume (in mL). The fitting error levels off around sixth order (with 49 model parameters), with a fitting error of 3.1 mm. B, The top view and (C) the side view of the sixth‐order fitted surfaces (shaded green) where the light gray curves are the contour points.
