Figure 4.

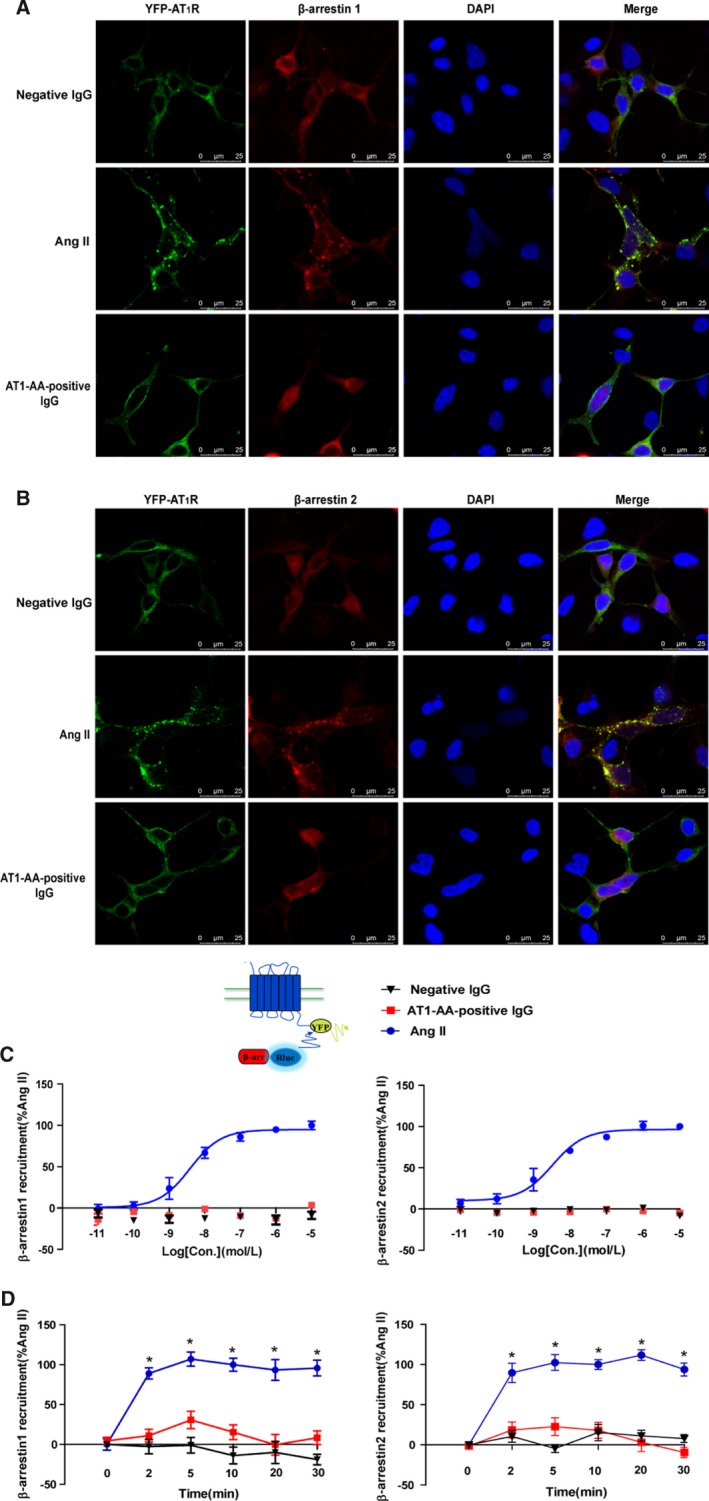
AT1‐AA‐positive IgG attenuated the recruitment of β‐arrestin1 and β‐arrestin2. Representative images of fluorescence tracking are shown. YFP‐labeled AT1R (1 μg) and RFP‐labeled β‐arrestin1 (1 μg) were co‐expressed in HEK293 cells. Treatment with Ang II (1 μmol/L) at 37°C for 10 minutes, AT1R, and β‐arrestin1 were colocalized in the cell surface and cytoplasm (middle). However, for negative IgG (upper) and AT1‐AA‐positive IgG (bottom), there was rarely colocalization between AT1R and β‐arrestin1 (A). Similarly, there was rarely colocalization between AT1R and β‐arrestin2 after treatment with negative IgG and AT1‐AA‐positive IgG (B). To confirm these findings by BRET, the relative change of BRET ratio was to represent the interaction between YFP‐labeled AT1R with RLuc‐β‐arrestin1 or β‐arrestin2. The BRET ratio with 1 μmol/L Ang II for 10 minutes was set to 100%. As concentration increased, the relative change of BRET ratio also increased upon Ang II (EC50β‐arrestin1/2=6.7±4.1/6.3±2.3 nmol/L). However, for AT1‐AA‐positive IgG, there was no significant change (C). Over time, AT1‐AA‐positive IgG (1 μmol/L) attenuated the recruitment of β‐arrestin1 and β‐arrestin2 more than Ang II did (D). (Data are presented as mean±SEM, n=4, *P<0.05 vs 0 minute in Ang II group, 1‐way ANOVA with Bonferroni post hoc test). Ang II indicates angiotensin II; AT1‐AA, angiotensin II type 1 receptor autoantibody; AT1R, angiotensin II type 1 receptor; BRET, bioluminescence resonance energy transfer; RFP, red fluorescence protein; YFP, yellow fluorescence protein.
