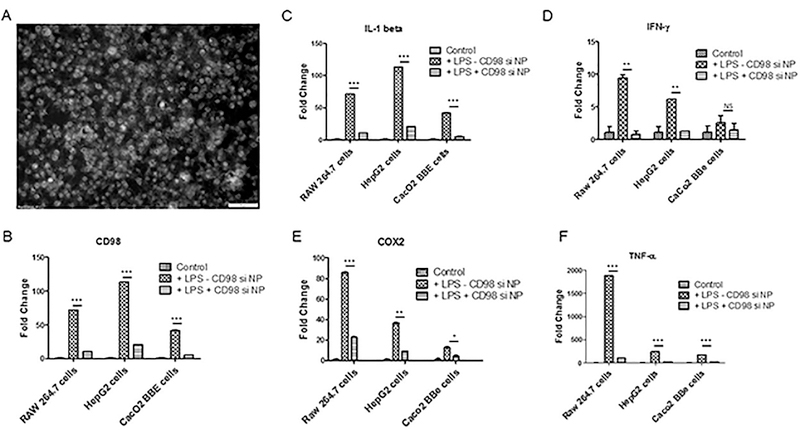
Figure 2: FITC-tagged siRNA/PEI-loaded NPs covered with PLA are rapidly taken up by hepatic cells (HepG2 cells) and the CD98 siRNA is successfully delivered to the cytosol.
(A) Fluorescent microcopy of FITC-tagged siRNA/PEI-loaded NPs (200μg/mL, 100μL) uptaken by HepG2 cells after overnight contact NPs/ HepG2 cells (gray scale picture). (B) Level of CD98 mRNA expression in non-stimulated HepG2 cells (control) or LPS-stimulated (10 μg/mL LPS for a period of 24h) pretreated overnight with CD98 siRNA-loaded NPs (200μg/mL, 100μL) (+LPS+CD98 si NPs) and scrambled siRNA loaded NPs (200μg/mL, 100μL) (+LPS-CD98 si NPs). (C) Level of IL1-β mRNA expression in non-stimulated HepG2 cells (control) or LPS-stimulated pretreated overnight with CD98 siRNA-loaded NPs (200μg/mL, 100μL) (+LPS+CD98 si NPs) and scrambled siRNA loaded NPs (200μg/mL, 100μL) (+LPS-CD98 si NPs). (D) Level of IFN-γ mRNA expression in non-stimulated HepG2 cells (control) or LPS-stimulated pretreated pretreated overnight with CD98 siRNA-loaded NPs (200μg/mL, 100μL) (+LPS+CD98 si NPs) and scrambled siRNA loaded NPs (200μg/mL, 100μL) (+LPS-CD98 si NPs). (E) Level of Cox-2 mRNA expression in non-stimulated HepG2 cells (control) or LPS-stimulated pretreated overnight with CD98 siRNA-loaded NPs (200μg/mL, 100μL) (+LPS+CD98 si NPs) and scrambled siRNA loaded NPs (200μg/mL, 100μL) (+LPS-CD98 si NPs). (F) Level of TNF-α mRNA expression in non-stimulated HepG2 cells (control) or LPS-stimulated pretreated overnight with CD98 siRNA-loaded NPs (200μg/mL, 100μL) (+LPS+CD98 si NPs) and scrambled siRNA loaded NPs (200μg/mL, 100μL) (+LPS-CD98 si NPs). Values represent means ± SE. Data are representative of n=3 determinations. ***P < 0.001, **P < 0.01, *P < 0.05 and NS, not statically significant.

