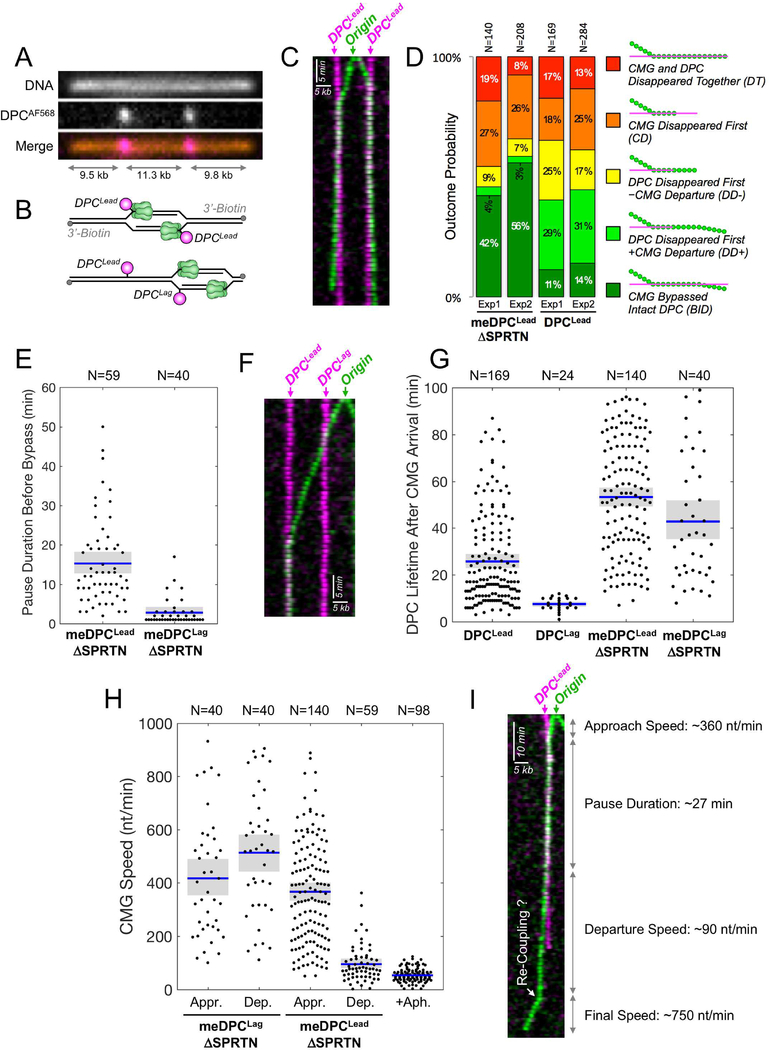
Figure 6. Direct observation of DPC bypass by CMG.
(A) Stretched and immobilized DNA-DPC substrate. DNA was stained with sytox orange (top panel). The DPC was labeled on its C-terminus with AF568 (middle panel). Merge, bottom panel. (B) Cartoons depicting how the location of initiation determines whether CMGs encounter DPCLead (top) or DPCLag followed by DPCLead (bottom) (C) Kymogram of a meDPC substrate undergoing replication in SPRTN-depleted extract from an origin that fired between the DPCs. Both CMGs undergo DPC bypass. Images were acquired at 1 frame/min. Green, AF647; pink, AF568. (D) Quantification of five different classes of CMG-DPCLead encounters in n=2 independent biological repeats: (i) BID, Bypass of intact DPC, representing unambiguous bypass events; (ii) DD+, DPC disappeared first, followed by CMG departure from the pause site. When proteolysis was inhibited (meDPC, ΔSPRTN extract), DD+ events likely involve DPC bypass but do not meet the BID criteria due to DPC photobleaching; (iii) DD-, DPC disappeared first, without CMG departure from the pause site, including potential bypass events where CMG photobleached or DNA ruptured soon after the DPC signal vanished; (iv) CD, CMG disappeared first, likely due to photobleaching, obscuring any subsequent bypass events; (v) DT, CMG and DPC disappeared together, including events where the experiment ended or the DNA ruptured before bypass could be detected. Due to rounding errors, probabilities may not add up to 100%. N represents the number of molecules. (E) Beeswarm plot of the time needed to bypass meDPCLead or meDPCLag in SPRTN-depleted extract. Blue lines and gray boxes correspond to the mean and the 95% CI for the mean, respectively. N represents the number of molecules. (F) Same as (C) but showing a kymogram in which an origin fired to the right of both lesions. The leftward-moving helicase (green) first bypassed a meDPCLag in ~1 min, then reached a meDPCLead where it paused. (G) Beeswarm plot of DPC lifetime after CMG arrival at the lesion. Blue lines, gray boxes, and N as in (E). (H) Beeswarm plot of CMG speed during approach to (Appr.) and departure from (Dep.) DPC lesions versus the speed of aphidicolin-uncoupled helicases. Blue lines, gray boxes, and N as in (E). The aphidicolin condition was performed on λ DNA. (I) Kymogram of CMG-meDPCLead encounter (SPRTN-depleted extract) that resulted in DPC bypass and CMG uncoupling, followed by apparent re-coupling (white arrow).

