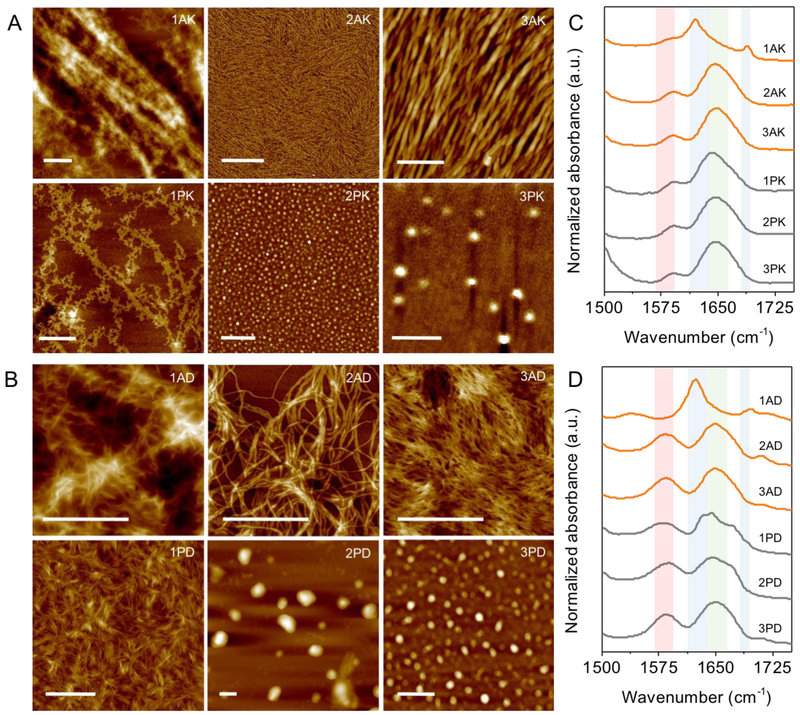
Figure 2.
AFM images and FTIR spectra of self-assembled peptide nanostructures. (A-B) 1 AK/AD form large fibers organized in anti-parallel β-sheet arrangement, 2-3 AK/AD and 1 PK/PD form elongated worm-like micelles, and 2-3 PK/PD form spherical micelles. Scale bar 500 nm. Additional AFM images can be found in Figure S5 in SI. (C-D) FTIR spectra of the peptides in amide I region. Red shade highlights the carboxylate groups (1580-1590 cm−1) which can red shift to lower wavenumber (1541 cm−1 for 1 AD) upon cation complexation,37 blue shade highlights parallel β-sheet (near 1620 cm−1) and anti-parallel β-sheet (additional peak at1688 cm−1) hydrogen bonding of the peptide backbones, and the green shade highlights disordered hydrogen bonds (1640-1650 cm−1). Peaks are listed in Table S2 in SI.

