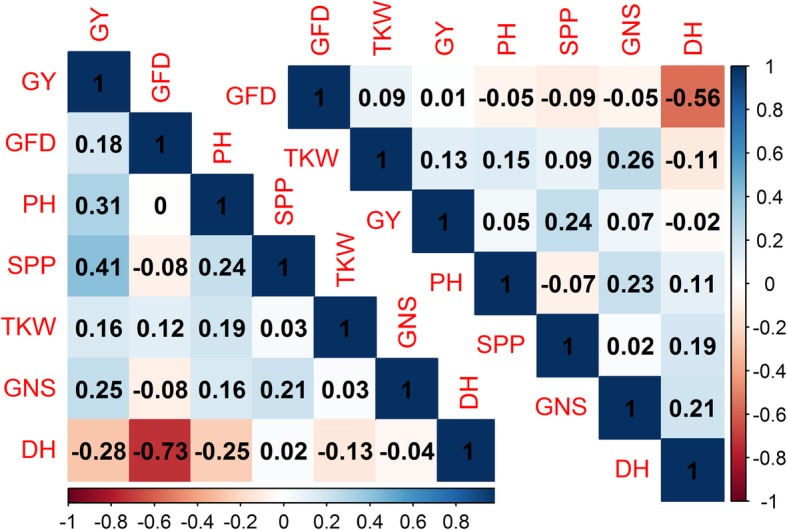
Fig. 1.

Pearson’s coefficient (r) of correlation among traits studied under normal sown (upper right diagonal) and late sown (lower left diagonal) conditions with traits arranged according to first principal component (FPC). The absolute value of 0.189 and 0.184 was found significant for normal sown and late sown trials respectively. DH: days to heading, GFD: grain filled duration, PH: plant height, SPP: spikes per plant, GNS: grain number per spike, TKW: thousand kernel weight and GY: grain yield
