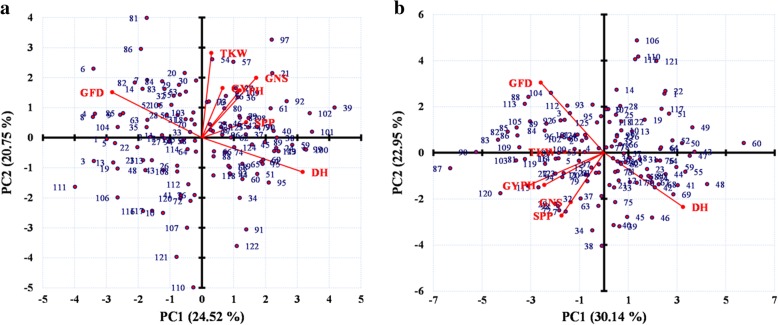
Fig. 2.
Biplot of studied traits with 125 genotypes under normal sown conditions (a) and under late sown conditions (b). PC1 and PC2 are the principal components along x-axis and y-axis respectively. Numbers are genotypes serial number as in Additional file 1: Table S1. Trait legends are same as in Table 1

