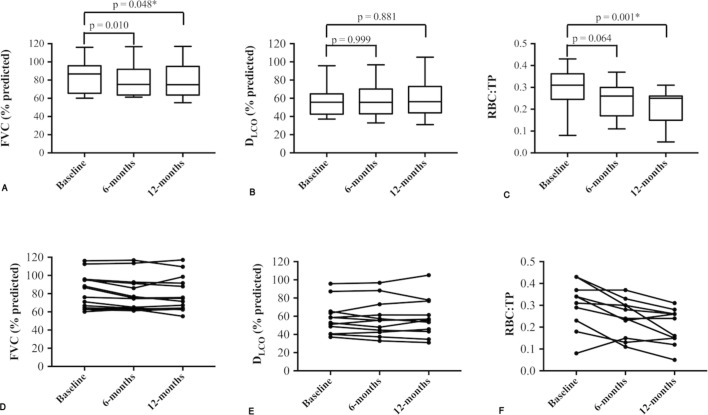
Figure 2.
Longitudinal change in FVC, DLCO and RBC:TP. (A–C): Box and whisker diagrams with associated Friedman’s test p values, representing 6-month and 12-month follow-up change in FVC, DLCO and 129-xenon MR-derived RBC:TP ratio. Note that a statistically significant difference was not demonstrated in DLCO (B), whereas FVC (A) and RBC:TP (C) declined significantly over 12 months. Individual participants’ metrics of FVC, DLCO and RBC:TP at baseline, 6 and 12 months are plotted in (D), (E) and (F), respectively. DLCO, diffusing capacity of the lungs for carbon monoxide; FVC, forced vital capacity; RBC:TP, red blood cell to tissue/plasma.

