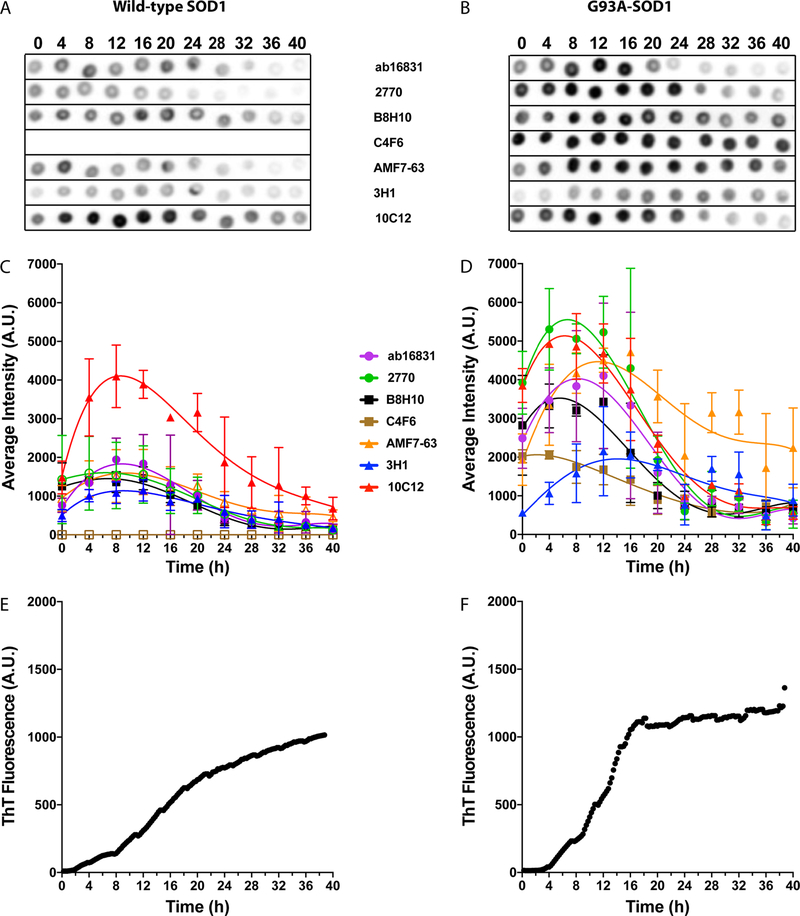
Figure 4.
Antibody reactivity for WT and G93A-SOD1 under reducing conditions in reactions with short “pause” (P1) periods. Aliquots from the same aggregation reactions shown in Figure 1 were taken every 4 h and dot-blotted on nitrocellulose membranes. At the end of the experiment, each membrane was blocked and then probed, stripped, and reprobed with the seven different antibodies. The order of the antibodies was changed in different experiments to avoid bias due to loss of protein during strip and reprobe cycles. (A,B) Representative dot blots of WT (A) and G93A- (B) SOD1 reactions in which the initial plateau phase, P1, was relatively short, i.e., ≤10 h for WT SOD1 and ≤7 h for G93A-SOD1, incubated under reducing conditions at different time points. (C,D) Averaged values from densitometric analysis of two independent experiments, including a total of nine replicates of WT (C) and six replicates of G93A- (D) SOD1. The lines are added to help guide the eye but do not imply that the points should be connected. Filled symbols represent cases in which the change in antibody binding during the reaction was found to be statistically significant, whereas empty symbols represent insignificant changes (one-way ANOVA). (E,F) Representative ThT fluorescence curves from the same reactions of WT (E) and G93A- (F) SOD1.

