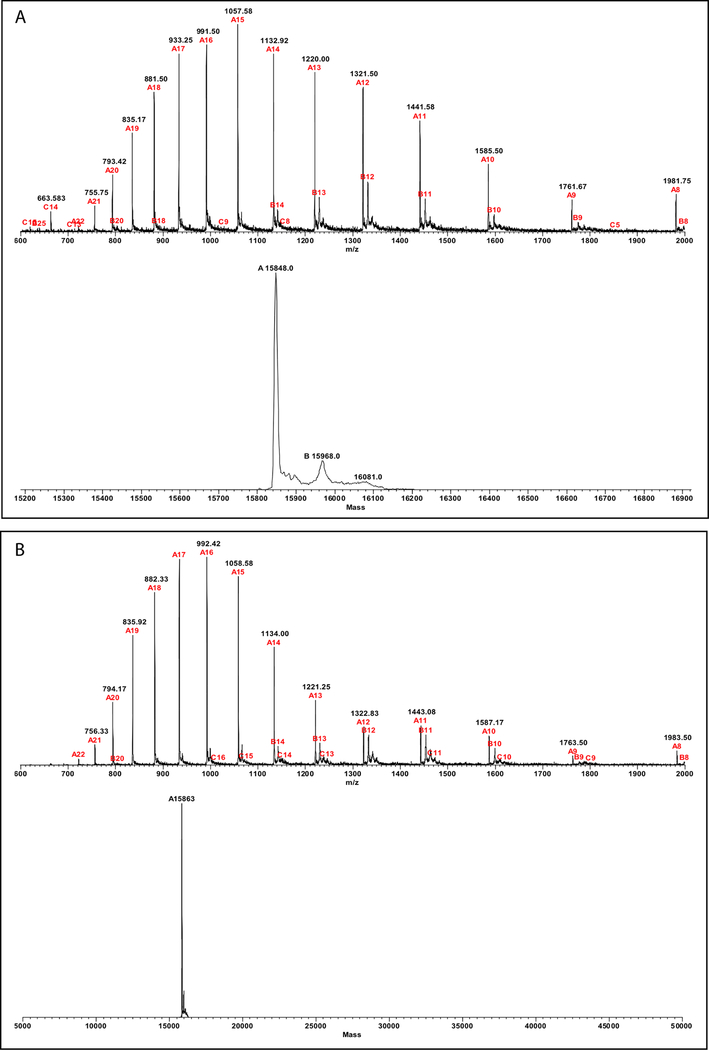
Figure 6.
Mass-spectrometry characterization of WT and G93A-SOD1. Each protein was incubated in the presence of 0.25 M DTT for 10 min at RT and then subjected to LC-MS analysis. (A) Recorded (top) and deconvoluted (bottom) spectra of WT SOD1. (B) Recorded (top) and deconvoluted (bottom) spectra of G93A-SOD1. The fragmentation type (A, B, or C) and charge of each fragment is indicated in red and the observed mass in black.

