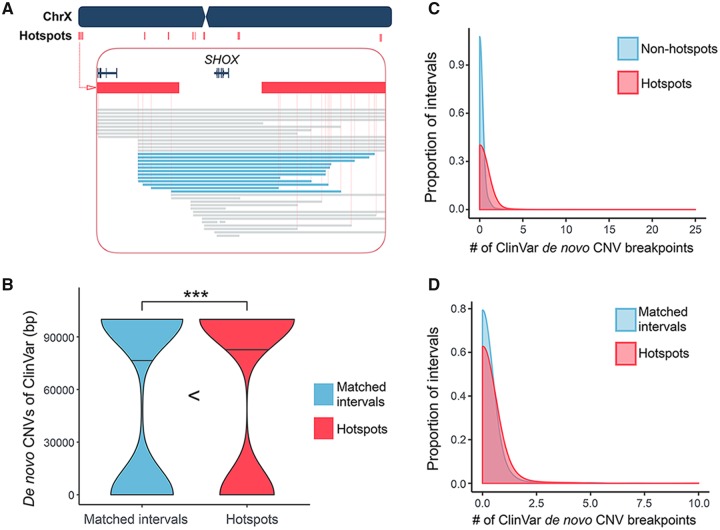
Fig. 6.
—The SV hotspots and the de novo CNVs. (A) A snapshot of the SV hotspots around the SHOX gene on chrX. There are two consecutive SV hotspots at the telomeric side of SHOX gene and three consecutive SV hotspots at its centromeric side (red bars). The deletions found in SHOX deficiency patients are represented as blue bars. There are twelve recurrent deletions spanned the hotspot regions on each side of the SHOX gene. Note that the breakpoints of these deletions are estimated as the midpoints of nearby mapping markers. The exact breakpoints may be more variable. (B) The number of base pair(s) affected by de novo CNVs from the ClinVar data in SV hotspots (red) and their matched intervals (blue). The dump-belled shape of the violin plots implicates that a majority of ClinVar de novo CNVs are probably larger than a single interval. The *** signs indicate where there is a significant difference with a P value <0.05, calculated by Mann–Whitney U test. (C) Overlays the density plots of the number of de novo CNV breakpoint(s) coincides with each of the hotspots (red) and nonhotspot intervals (blue). The enrichment of de novo CNV breakpoints in SV hotspots has a P value of 1.136 × 10⁻⁵, calculated by Mann–Whitney U test. (D) Overlays the density plots of the number of de novo CNV breakpoint(s) coincides with each of the hotspots (red) and nonhotspot intervals with matched segmental-duplication content (blue). The enrichment of de novo CNV breakpoints in SV hotspots has a P value of 0.008582, calculated by Mann–Whitney U test.

